Immigrants from Bahamas vs Immigrants from Central America In Labor Force | Age 35-44

COMPARE

Immigrants from Bahamas
Race
Ancestry
AfghanAfricanAlaska NativeAlaskan AthabascanAlbanianAleutAlsatianAmericanApacheArabArapahoArgentineanArmenianAssyrian/Chaldean/SyriacAustralianAustrianBahamianBangladeshiBarbadianBasqueBelgianBelizeanBermudanBhutaneseBlackfeetBolivianBrazilianBritishBritish West IndianBulgarianBurmeseCajunCambodianCanadianCape VerdeanCarpatho RusynCelticCentral AmericanCentral American IndianCherokeeCheyenneChickasawChileanChineseChippewaChoctawColombianColvilleComancheCosta RicanCreeCreekCroatianCrowCubanCypriotCzechCzechoslovakianDanishDelawareDominicanDutchDutch West IndianEastern EuropeanEcuadorianEgyptianEnglishEstonianEthiopianEuropeanFijianFilipinoFinnishFrenchFrench American IndianFrench CanadianGermanGerman RussianGhanaianGreekGuamanian/ChamorroGuatemalanGuyaneseHaitianHmongHonduranHopiHoumaHungarianIcelanderIndian (Asian)IndonesianInupiatIranianIraqiIrishIroquoisIsraeliItalianJamaicanJapaneseJordanianKenyanKiowaKoreanLaotianLatvianLebaneseLiberianLithuanianLumbeeLuxembourgerMacedonianMalaysianMalteseMarshalleseMenomineeMexicanMexican American IndianMongolianMoroccanNative HawaiianNavajoNepaleseNew ZealanderNicaraguanNigerianNorthern EuropeanNorwegianOkinawanOsageOttawaPaiutePakistaniPalestinianPanamanianParaguayanPennsylvania GermanPeruvianPimaPolishPortuguesePotawatomiPuebloPuerto RicanPuget Sound SalishRomanianRussianSalvadoranSamoanScandinavianScotch-IrishScottishSeminoleSenegaleseSerbianShoshoneSierra LeoneanSiouxSlavicSlovakSloveneSomaliSouth AfricanSouth AmericanSouth American IndianSoviet UnionSpaniardSpanishSpanish AmericanSpanish American IndianSri LankanSubsaharan AfricanSudaneseSwedishSwissSyrianTaiwaneseThaiTlingit-HaidaTohono O'OdhamTonganTrinidadian and TobagonianTsimshianTurkishU.S. Virgin IslanderUgandanUkrainianUruguayanUteVenezuelanVietnameseWelshWest IndianYakamaYaquiYugoslavianYumanYup'ikZimbabwean
Immigration
NonimmigrantsImmigrantsAfghanistanAfricaAlbaniaArgentinaArmeniaAsiaAustraliaAustriaBahamasBangladeshBarbadosBelarusBelgiumBelizeBoliviaBosnia and HerzegovinaBrazilBulgariaBurma/MyanmarCabo VerdeCambodiaCameroonCanadaCaribbeanChileChinaColombiaCongoCosta RicaCroatiaCubaCzechoslovakiaDenmarkDominicaDominican RepublicEastern AfricaEastern AsiaEastern EuropeEcuadorEgyptEl SalvadorEnglandEritreaEthiopiaEuropeFijiFranceGermanyGhanaGreeceGrenadaGuatemalaGuyanaHaitiHondurasHong KongHungaryIndiaIndonesiaIranIraqIrelandIsraelItalyJamaicaJapanJordanKazakhstanKenyaKoreaKuwaitLaosLatin AmericaLatviaLebanonLiberiaLithuaniaMalaysiaMexicoMicronesiaMiddle AfricaMoldovaMoroccoNepalNetherlandsNicaraguaNigeriaNorth AmericaNorth MacedoniaNorthern AfricaNorthern EuropeNorwayOceaniaPakistanPanamaPeruPhilippinesPolandPortugalRomaniaRussiaSaudi ArabiaScotlandSenegalSerbiaSierra LeoneSingaporeSomaliaSouth AfricaSouth AmericaSouth Central AsiaSouth Eastern AsiaSouthern EuropeSpainSri LankaSt. Vincent and the GrenadinesSudanSwedenSwitzerlandSyriaTaiwanThailandTrinidad and TobagoTurkeyUgandaUkraineUruguayUzbekistanVenezuelaVietnamWest IndiesWestern AfricaWestern AsiaWestern EuropeYemenZaireZimbabweAzores
Immigrants from Central America
Race
Ancestry
AfghanAfricanAlaska NativeAlaskan AthabascanAlbanianAleutAlsatianAmericanApacheArabArapahoArgentineanArmenianAssyrian/Chaldean/SyriacAustralianAustrianBahamianBangladeshiBarbadianBasqueBelgianBelizeanBermudanBhutaneseBlackfeetBolivianBrazilianBritishBritish West IndianBulgarianBurmeseCajunCambodianCanadianCape VerdeanCarpatho RusynCelticCentral AmericanCentral American IndianCherokeeCheyenneChickasawChileanChineseChippewaChoctawColombianColvilleComancheCosta RicanCreeCreekCroatianCrowCubanCypriotCzechCzechoslovakianDanishDelawareDominicanDutchDutch West IndianEastern EuropeanEcuadorianEgyptianEnglishEstonianEthiopianEuropeanFijianFilipinoFinnishFrenchFrench American IndianFrench CanadianGermanGerman RussianGhanaianGreekGuamanian/ChamorroGuatemalanGuyaneseHaitianHmongHonduranHopiHoumaHungarianIcelanderIndian (Asian)IndonesianInupiatIranianIraqiIrishIroquoisIsraeliItalianJamaicanJapaneseJordanianKenyanKiowaKoreanLaotianLatvianLebaneseLiberianLithuanianLumbeeLuxembourgerMacedonianMalaysianMalteseMarshalleseMenomineeMexicanMexican American IndianMongolianMoroccanNative HawaiianNavajoNepaleseNew ZealanderNicaraguanNigerianNorthern EuropeanNorwegianOkinawanOsageOttawaPaiutePakistaniPalestinianPanamanianParaguayanPennsylvania GermanPeruvianPimaPolishPortuguesePotawatomiPuebloPuerto RicanPuget Sound SalishRomanianRussianSalvadoranSamoanScandinavianScotch-IrishScottishSeminoleSenegaleseSerbianShoshoneSierra LeoneanSiouxSlavicSlovakSloveneSomaliSouth AfricanSouth AmericanSouth American IndianSoviet UnionSpaniardSpanishSpanish AmericanSpanish American IndianSri LankanSubsaharan AfricanSudaneseSwedishSwissSyrianTaiwaneseThaiTlingit-HaidaTohono O'OdhamTonganTrinidadian and TobagonianTsimshianTurkishU.S. Virgin IslanderUgandanUkrainianUruguayanUteVenezuelanVietnameseWelshWest IndianYakamaYaquiYugoslavianYumanYup'ikZimbabwean
Immigration
NonimmigrantsImmigrantsAfghanistanAfricaAlbaniaArgentinaArmeniaAsiaAustraliaAustriaBangladeshBarbadosBelarusBelgiumBelizeBoliviaBosnia and HerzegovinaBrazilBulgariaBurma/MyanmarCabo VerdeCambodiaCameroonCanadaCaribbeanCentral AmericaChileChinaColombiaCongoCosta RicaCroatiaCubaCzechoslovakiaDenmarkDominicaDominican RepublicEastern AfricaEastern AsiaEastern EuropeEcuadorEgyptEl SalvadorEnglandEritreaEthiopiaEuropeFijiFranceGermanyGhanaGreeceGrenadaGuatemalaGuyanaHaitiHondurasHong KongHungaryIndiaIndonesiaIranIraqIrelandIsraelItalyJamaicaJapanJordanKazakhstanKenyaKoreaKuwaitLaosLatin AmericaLatviaLebanonLiberiaLithuaniaMalaysiaMexicoMicronesiaMiddle AfricaMoldovaMoroccoNepalNetherlandsNicaraguaNigeriaNorth AmericaNorth MacedoniaNorthern AfricaNorthern EuropeNorwayOceaniaPakistanPanamaPeruPhilippinesPolandPortugalRomaniaRussiaSaudi ArabiaScotlandSenegalSerbiaSierra LeoneSingaporeSomaliaSouth AfricaSouth AmericaSouth Central AsiaSouth Eastern AsiaSouthern EuropeSpainSri LankaSt. Vincent and the GrenadinesSudanSwedenSwitzerlandSyriaTaiwanThailandTrinidad and TobagoTurkeyUgandaUkraineUruguayUzbekistanVenezuelaVietnamWest IndiesWestern AfricaWestern AsiaWestern EuropeYemenZaireZimbabweAzores
In Labor Force | Age 35-44
Income
Poverty
Unemployment
Labor Participation
Family Structure
Vehicle Availability
Education Level
Disability

In Labor Force | Age 35-44 Comparison

Immigrants from Bahamas

Immigrants from Central America

Exceptional
Tragic
84.8%
IN LABOR FORCE | AGE 35-44
94.8/ 100
METRIC RATING
106th/ 347
METRIC RANK
82.0%
IN LABOR FORCE | AGE 35-44
0.0/ 100
METRIC RATING
308th/ 347
METRIC RANK

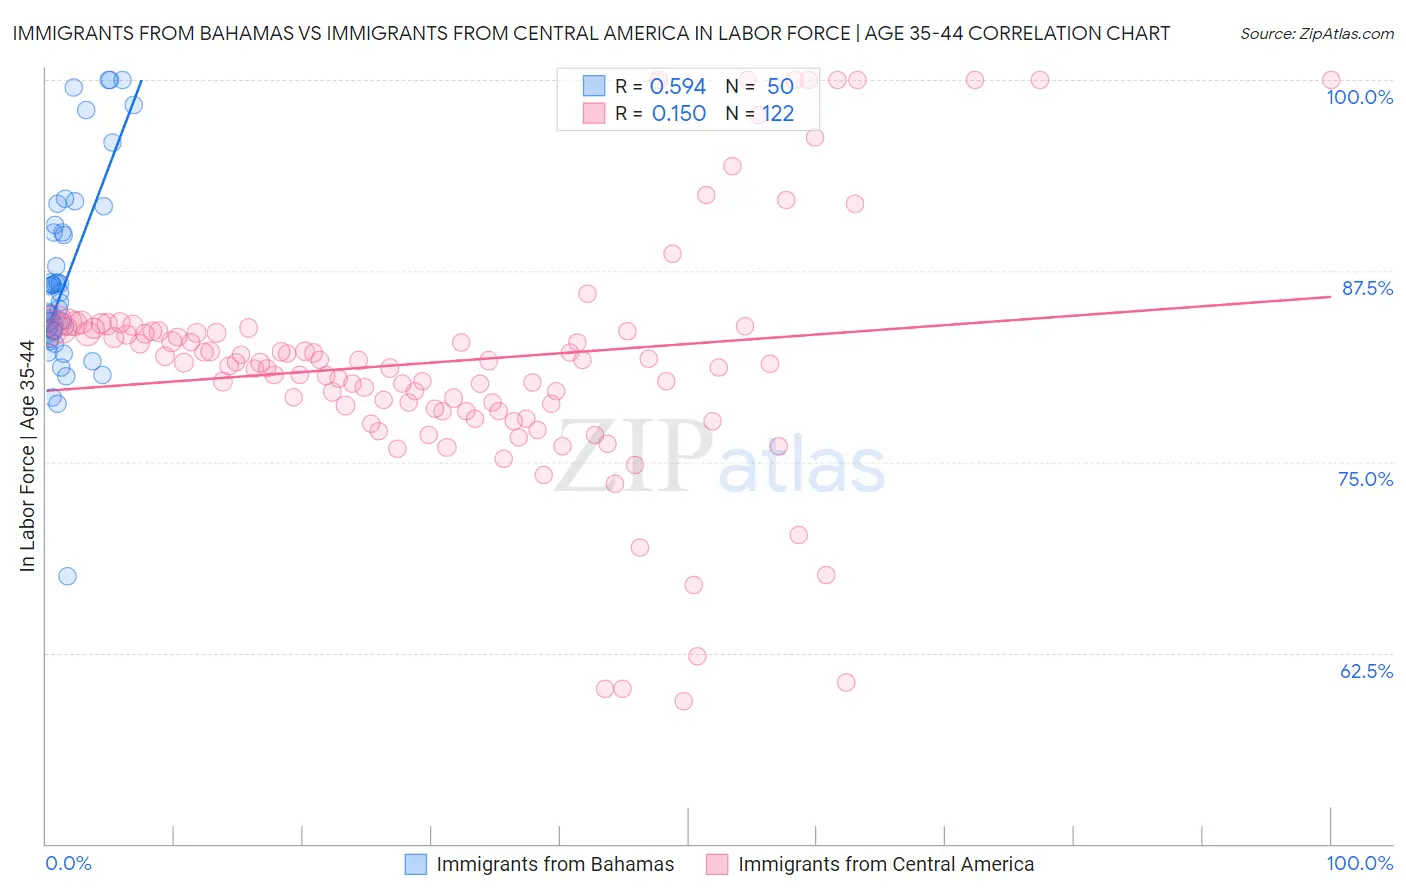
Immigrants from Bahamas vs Immigrants from Central America In Labor Force | Age 35-44 Correlation Chart

The statistical analysis conducted on geographies consisting of 104,601,766 people shows a substantial positive correlation between the proportion of Immigrants from Bahamas and labor force participation rate among population between the ages 35 and 44 in the United States with a correlation coefficient (R) of 0.594 and weighted average of 84.8%. Similarly, the statistical analysis conducted on geographies consisting of 536,091,768 people shows a poor positive correlation between the proportion of Immigrants from Central America and labor force participation rate among population between the ages 35 and 44 in the United States with a correlation coefficient (R) of 0.150 and weighted average of 82.0%, a difference of 3.4%.
Immigrants from Bahamas vs Immigrants from Central America In Labor Force | Age 35-44

In Labor Force | Age 35-44 Correlation Summary

MeasurementImmigrants from BahamasImmigrants from Central America
Minimum67.5%59.3%
Maximum100.0%100.0%
Range32.5%40.7%
Mean86.8%81.6%
Median85.2%81.5%
Interquartile 25% (IQ1)83.5%78.3%
Interquartile 75% (IQ3)90.0%83.5%
Interquartile Range (IQR)6.5%5.2%
Standard Deviation (Sample)6.4%8.0%
Standard Deviation (Population)6.3%8.0%

Similar Demographics by In Labor Force | Age 35-44

Demographics Similar to Immigrants from Bahamas by In Labor Force | Age 35-44

In terms of in labor force | age 35-44, the demographic groups most similar to Immigrants from Bahamas are Immigrants from Romania (84.8%, a difference of 0.0%), Immigrants from Belarus (84.8%, a difference of 0.010%), Immigrants from Sweden (84.8%, a difference of 0.010%), South American (84.8%, a difference of 0.010%), and Immigrants from Argentina (84.8%, a difference of 0.010%).
DemographicsRating | RankIn Labor Force | Age 35-44
Haitians
96.0
/100
|
#99
Exceptional
84.8%
Immigrants | Czechoslovakia
95.9
/100
|
#100
Exceptional
84.8%
Immigrants | Australia
95.5
/100
|
#101
Exceptional
84.8%
Immigrants | Southern Europe
95.3
/100
|
#102
Exceptional
84.8%
Immigrants | Belarus
95.3
/100
|
#103
Exceptional
84.8%
Immigrants | Sweden
95.2
/100
|
#104
Exceptional
84.8%
South Americans
95.0
/100
|
#105
Exceptional
84.8%
Immigrants | Bahamas
94.8
/100
|
#106
Exceptional
84.8%
Immigrants | Romania
94.7
/100
|
#107
Exceptional
84.8%
Immigrants | Argentina
94.5
/100
|
#108
Exceptional
84.8%
Immigrants | Russia
94.5
/100
|
#109
Exceptional
84.8%
Filipinos
93.8
/100
|
#110
Exceptional
84.7%
Ukrainians
93.5
/100
|
#111
Exceptional
84.7%
Immigrants | Western Africa
93.4
/100
|
#112
Exceptional
84.7%
Uruguayans
93.3
/100
|
#113
Exceptional
84.7%

Demographics Similar to Immigrants from Central America by In Labor Force | Age 35-44

In terms of in labor force | age 35-44, the demographic groups most similar to Immigrants from Central America are Cree (82.0%, a difference of 0.0%), Blackfeet (81.9%, a difference of 0.13%), Hispanic or Latino (82.1%, a difference of 0.15%), Black/African American (82.2%, a difference of 0.25%), and Shoshone (82.2%, a difference of 0.27%).
DemographicsRating | RankIn Labor Force | Age 35-44
Spanish American Indians
0.0
/100
|
#301
Tragic
82.5%
Americans
0.0
/100
|
#302
Tragic
82.4%
Nepalese
0.0
/100
|
#303
Tragic
82.4%
Marshallese
0.0
/100
|
#304
Tragic
82.4%
Shoshone
0.0
/100
|
#305
Tragic
82.2%
Blacks/African Americans
0.0
/100
|
#306
Tragic
82.2%
Hispanics or Latinos
0.0
/100
|
#307
Tragic
82.1%
Immigrants | Central America
0.0
/100
|
#308
Tragic
82.0%
Cree
0.0
/100
|
#309
Tragic
82.0%
Blackfeet
0.0
/100
|
#310
Tragic
81.9%
Colville
0.0
/100
|
#311
Tragic
81.7%
Alaska Natives
0.0
/100
|
#312
Tragic
81.6%
Mexicans
0.0
/100
|
#313
Tragic
81.6%
Cajuns
0.0
/100
|
#314
Tragic
81.5%
Immigrants | Mexico
0.0
/100
|
#315
Tragic
81.5%