Mexican vs Honduran Median Household Income
COMPARE
Mexican
Honduran
Median Household Income
Median Household Income Comparison
Mexicans
Hondurans
$74,399
MEDIAN HOUSEHOLD INCOME
0.1/ 100
METRIC RATING
285th/ 347
METRIC RANK
$72,588
MEDIAN HOUSEHOLD INCOME
0.0/ 100
METRIC RATING
305th/ 347
METRIC RANK
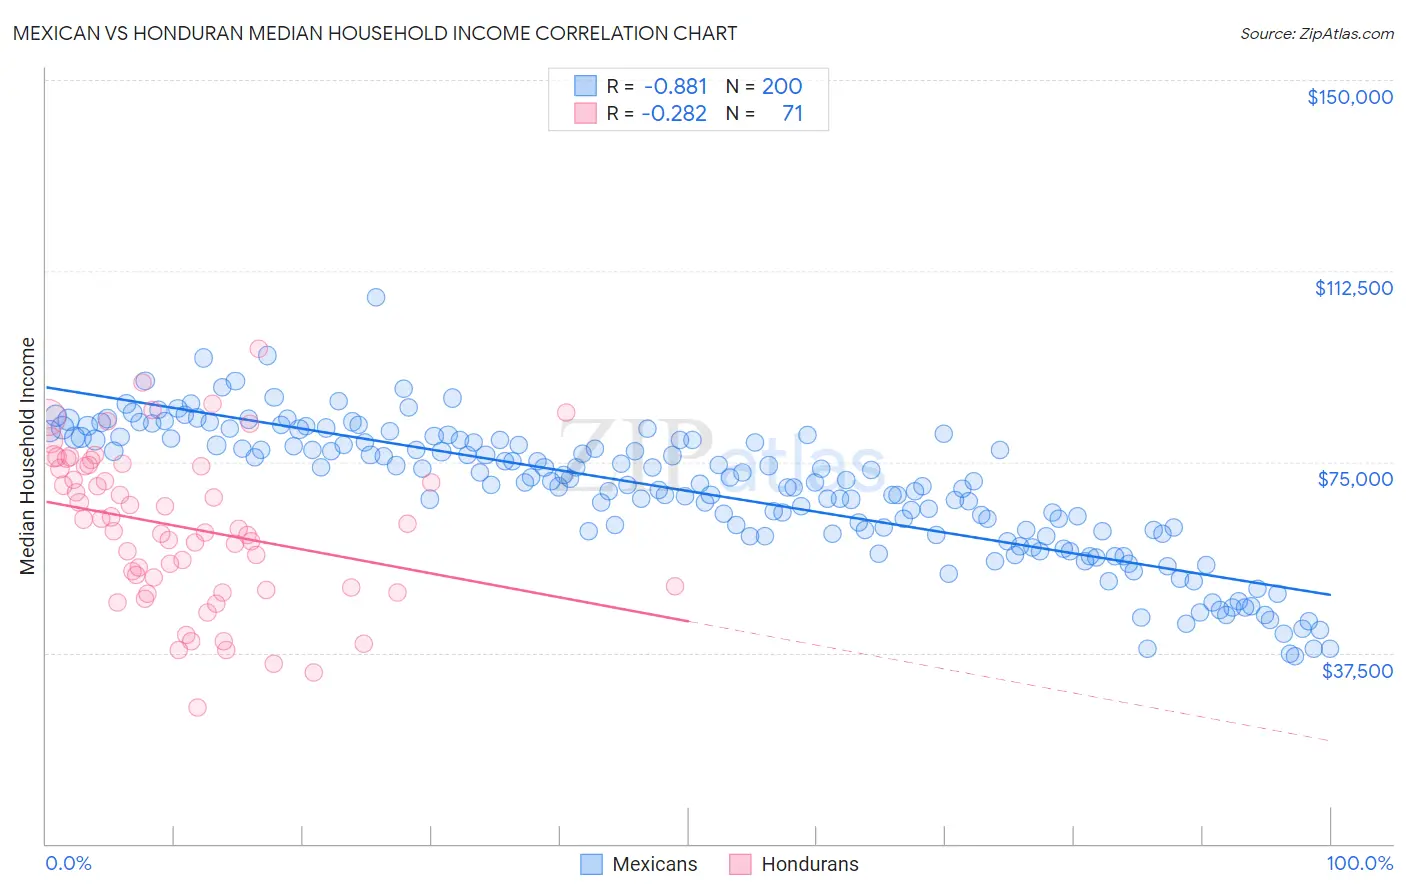
Mexican vs Honduran Median Household Income Correlation Chart
The statistical analysis conducted on geographies consisting of 564,134,448 people shows a very strong negative correlation between the proportion of Mexicans and median household income in the United States with a correlation coefficient (R) of -0.881 and weighted average of $74,399. Similarly, the statistical analysis conducted on geographies consisting of 357,531,795 people shows a weak negative correlation between the proportion of Hondurans and median household income in the United States with a correlation coefficient (R) of -0.282 and weighted average of $72,588, a difference of 2.5%.
Median Household Income Correlation Summary
| Measurement | Mexican | Honduran |
| Minimum | $36,747 | $26,822 |
| Maximum | $107,254 | $97,304 |
| Range | $70,506 | $70,482 |
| Mean | $69,252 | $62,141 |
| Median | $71,107 | $61,786 |
| Interquartile 25% (IQ1) | $60,819 | $50,302 |
| Interquartile 75% (IQ3) | $79,357 | $74,115 |
| Interquartile Range (IQR) | $18,537 | $23,813 |
| Standard Deviation (Sample) | $13,393 | $15,104 |
| Standard Deviation (Population) | $13,359 | $14,997 |
Demographics Similar to Mexicans and Hondurans by Median Household Income
In terms of median household income, the demographic groups most similar to Mexicans are Immigrants from Somalia ($74,300, a difference of 0.13%), Iroquois ($74,279, a difference of 0.16%), Immigrants from Central America ($74,217, a difference of 0.24%), Fijian ($74,205, a difference of 0.26%), and Bangladeshi ($74,112, a difference of 0.39%). Similarly, the demographic groups most similar to Hondurans are Immigrants from Haiti ($72,599, a difference of 0.020%), African ($72,650, a difference of 0.090%), Shoshone ($72,660, a difference of 0.10%), Cherokee ($72,682, a difference of 0.13%), and Immigrants from Dominica ($72,760, a difference of 0.24%).
| Demographics | Rating | Rank | Median Household Income |
| Mexicans | 0.1 /100 | #285 | Tragic $74,399 |
| Immigrants | Somalia | 0.1 /100 | #286 | Tragic $74,300 |
| Iroquois | 0.1 /100 | #287 | Tragic $74,279 |
| Immigrants | Central America | 0.1 /100 | #288 | Tragic $74,217 |
| Fijians | 0.1 /100 | #289 | Tragic $74,205 |
| Bangladeshis | 0.1 /100 | #290 | Tragic $74,112 |
| Hispanics or Latinos | 0.1 /100 | #291 | Tragic $73,823 |
| Comanche | 0.1 /100 | #292 | Tragic $73,747 |
| Immigrants | Cabo Verde | 0.1 /100 | #293 | Tragic $73,515 |
| Blackfeet | 0.1 /100 | #294 | Tragic $73,509 |
| Cubans | 0.1 /100 | #295 | Tragic $73,392 |
| Haitians | 0.1 /100 | #296 | Tragic $73,306 |
| Immigrants | Mexico | 0.0 /100 | #297 | Tragic $73,160 |
| Paiute | 0.0 /100 | #298 | Tragic $72,959 |
| Indonesians | 0.0 /100 | #299 | Tragic $72,856 |
| Immigrants | Dominica | 0.0 /100 | #300 | Tragic $72,760 |
| Cherokee | 0.0 /100 | #301 | Tragic $72,682 |
| Shoshone | 0.0 /100 | #302 | Tragic $72,660 |
| Africans | 0.0 /100 | #303 | Tragic $72,650 |
| Immigrants | Haiti | 0.0 /100 | #304 | Tragic $72,599 |
| Hondurans | 0.0 /100 | #305 | Tragic $72,588 |