Immigrants from Austria vs Laotian Householder Income Ages 45 - 64 years
COMPARE
Immigrants from Austria
Laotian
Householder Income Ages 45 - 64 years
Householder Income Ages 45 - 64 years Comparison
Immigrants from Austria
Laotians
$113,140
HOUSEHOLDER INCOME AGES 45 - 64 YEARS
99.8/ 100
METRIC RATING
50th/ 347
METRIC RANK
$111,051
HOUSEHOLDER INCOME AGES 45 - 64 YEARS
99.5/ 100
METRIC RATING
67th/ 347
METRIC RANK
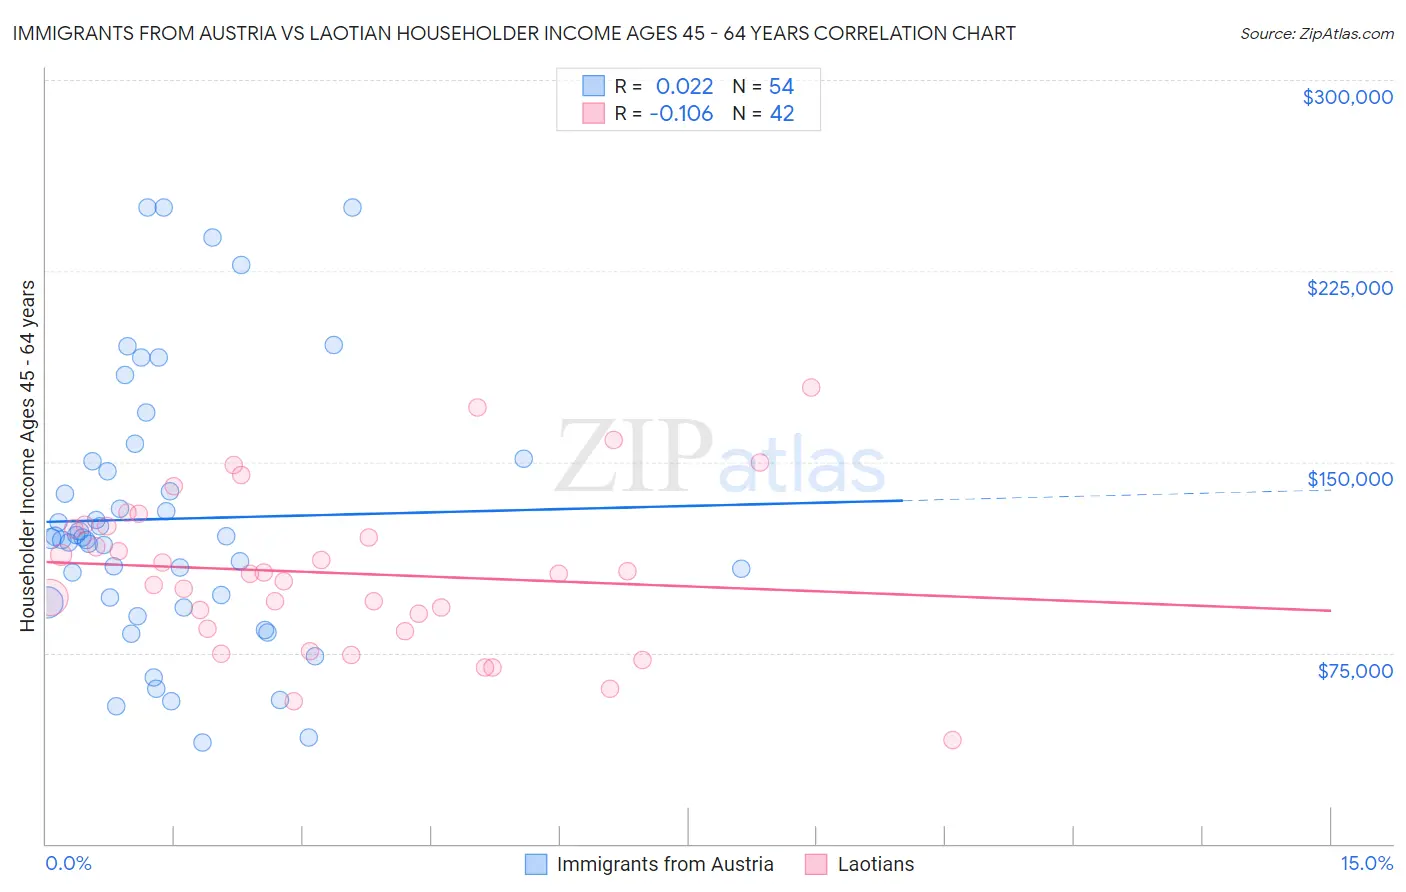
Immigrants from Austria vs Laotian Householder Income Ages 45 - 64 years Correlation Chart
The statistical analysis conducted on geographies consisting of 167,924,064 people shows no correlation between the proportion of Immigrants from Austria and household income with householder between the ages 45 and 64 in the United States with a correlation coefficient (R) of 0.022 and weighted average of $113,140. Similarly, the statistical analysis conducted on geographies consisting of 224,613,434 people shows a poor negative correlation between the proportion of Laotians and household income with householder between the ages 45 and 64 in the United States with a correlation coefficient (R) of -0.106 and weighted average of $111,051, a difference of 1.9%.
Householder Income Ages 45 - 64 years Correlation Summary
| Measurement | Immigrants from Austria | Laotian |
| Minimum | $39,554 | $40,547 |
| Maximum | $250,001 | $179,286 |
| Range | $210,447 | $138,739 |
| Mean | $127,653 | $106,378 |
| Median | $120,029 | $106,231 |
| Interquartile 25% (IQ1) | $95,004 | $84,487 |
| Interquartile 75% (IQ3) | $150,192 | $124,834 |
| Interquartile Range (IQR) | $55,187 | $40,347 |
| Standard Deviation (Sample) | $52,842 | $30,879 |
| Standard Deviation (Population) | $52,351 | $30,509 |
Demographics Similar to Immigrants from Austria and Laotians by Householder Income Ages 45 - 64 years
In terms of householder income ages 45 - 64 years, the demographic groups most similar to Immigrants from Austria are Immigrants from Russia ($113,215, a difference of 0.070%), Immigrants from South Africa ($112,886, a difference of 0.22%), Immigrants from Malaysia ($112,796, a difference of 0.30%), Immigrants from Indonesia ($113,519, a difference of 0.34%), and Afghan ($112,676, a difference of 0.41%). Similarly, the demographic groups most similar to Laotians are New Zealander ($111,286, a difference of 0.21%), Immigrants from Belarus ($111,430, a difference of 0.34%), Immigrants from Latvia ($111,454, a difference of 0.36%), Immigrants from Romania ($110,633, a difference of 0.38%), and Mongolian ($111,602, a difference of 0.50%).
| Demographics | Rating | Rank | Householder Income Ages 45 - 64 years |
| Immigrants | Indonesia | 99.9 /100 | #48 | Exceptional $113,519 |
| Immigrants | Russia | 99.8 /100 | #49 | Exceptional $113,215 |
| Immigrants | Austria | 99.8 /100 | #50 | Exceptional $113,140 |
| Immigrants | South Africa | 99.8 /100 | #51 | Exceptional $112,886 |
| Immigrants | Malaysia | 99.8 /100 | #52 | Exceptional $112,796 |
| Afghans | 99.8 /100 | #53 | Exceptional $112,676 |
| Greeks | 99.8 /100 | #54 | Exceptional $112,630 |
| Lithuanians | 99.8 /100 | #55 | Exceptional $112,484 |
| Egyptians | 99.7 /100 | #56 | Exceptional $112,256 |
| Immigrants | Scotland | 99.7 /100 | #57 | Exceptional $112,175 |
| Soviet Union | 99.7 /100 | #58 | Exceptional $112,008 |
| Immigrants | Europe | 99.7 /100 | #59 | Exceptional $111,984 |
| Immigrants | Netherlands | 99.7 /100 | #60 | Exceptional $111,982 |
| Immigrants | Czechoslovakia | 99.7 /100 | #61 | Exceptional $111,914 |
| Immigrants | Norway | 99.7 /100 | #62 | Exceptional $111,669 |
| Mongolians | 99.6 /100 | #63 | Exceptional $111,602 |
| Immigrants | Latvia | 99.6 /100 | #64 | Exceptional $111,454 |
| Immigrants | Belarus | 99.6 /100 | #65 | Exceptional $111,430 |
| New Zealanders | 99.6 /100 | #66 | Exceptional $111,286 |
| Laotians | 99.5 /100 | #67 | Exceptional $111,051 |
| Immigrants | Romania | 99.4 /100 | #68 | Exceptional $110,633 |