Immigrants from Argentina vs Spanish American Per Capita Income
COMPARE
Immigrants from Argentina
Spanish American
Per Capita Income
Per Capita Income Comparison
Immigrants from Argentina
Spanish Americans
$49,627
PER CAPITA INCOME
99.9/ 100
METRIC RATING
64th/ 347
METRIC RANK
$39,012
PER CAPITA INCOME
0.5/ 100
METRIC RATING
265th/ 347
METRIC RANK
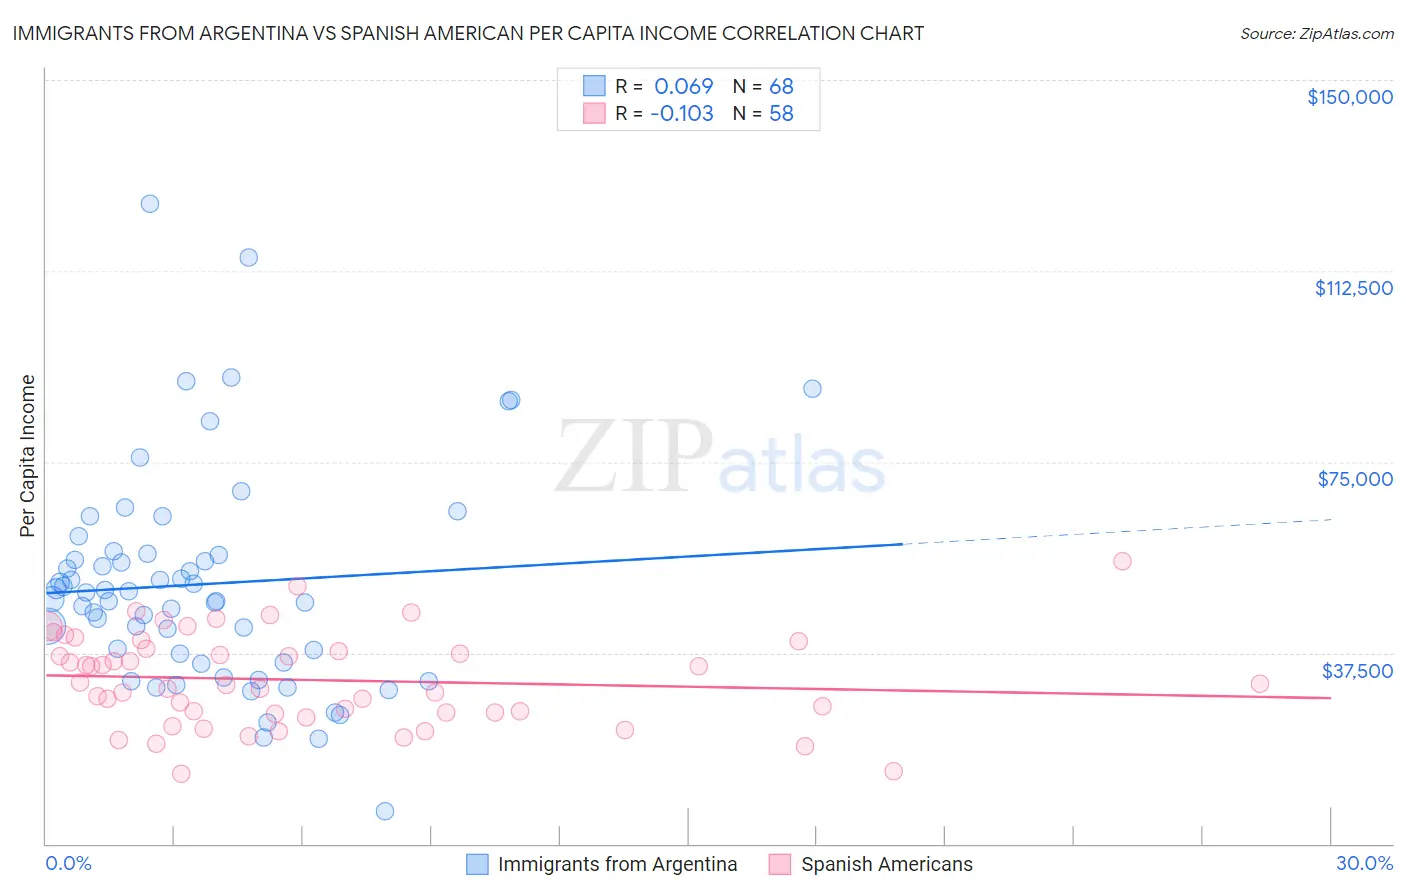
Immigrants from Argentina vs Spanish American Per Capita Income Correlation Chart
The statistical analysis conducted on geographies consisting of 264,438,412 people shows a slight positive correlation between the proportion of Immigrants from Argentina and per capita income in the United States with a correlation coefficient (R) of 0.069 and weighted average of $49,627. Similarly, the statistical analysis conducted on geographies consisting of 103,168,021 people shows a poor negative correlation between the proportion of Spanish Americans and per capita income in the United States with a correlation coefficient (R) of -0.103 and weighted average of $39,012, a difference of 27.2%.
Per Capita Income Correlation Summary
| Measurement | Immigrants from Argentina | Spanish American |
| Minimum | $6,333 | $13,649 |
| Maximum | $125,688 | $55,562 |
| Range | $119,355 | $41,913 |
| Mean | $51,000 | $32,169 |
| Median | $48,720 | $31,264 |
| Interquartile 25% (IQ1) | $36,471 | $25,700 |
| Interquartile 75% (IQ3) | $56,811 | $38,250 |
| Interquartile Range (IQR) | $20,340 | $12,550 |
| Standard Deviation (Sample) | $21,495 | $9,124 |
| Standard Deviation (Population) | $21,336 | $9,045 |
Similar Demographics by Per Capita Income
Demographics Similar to Immigrants from Argentina by Per Capita Income
In terms of per capita income, the demographic groups most similar to Immigrants from Argentina are Maltese ($49,640, a difference of 0.030%), Bolivian ($49,526, a difference of 0.20%), Immigrants from Asia ($49,741, a difference of 0.23%), Immigrants from Bulgaria ($49,482, a difference of 0.29%), and Immigrants from Romania ($49,463, a difference of 0.33%).
| Demographics | Rating | Rank | Per Capita Income |
| South Africans | 99.9 /100 | #57 | Exceptional $50,044 |
| Immigrants | Malaysia | 99.9 /100 | #58 | Exceptional $49,983 |
| Bhutanese | 99.9 /100 | #59 | Exceptional $49,894 |
| Immigrants | Scotland | 99.9 /100 | #60 | Exceptional $49,893 |
| Argentineans | 99.9 /100 | #61 | Exceptional $49,862 |
| Immigrants | Asia | 99.9 /100 | #62 | Exceptional $49,741 |
| Maltese | 99.9 /100 | #63 | Exceptional $49,640 |
| Immigrants | Argentina | 99.9 /100 | #64 | Exceptional $49,627 |
| Bolivians | 99.9 /100 | #65 | Exceptional $49,526 |
| Immigrants | Bulgaria | 99.9 /100 | #66 | Exceptional $49,482 |
| Immigrants | Romania | 99.9 /100 | #67 | Exceptional $49,463 |
| Lithuanians | 99.8 /100 | #68 | Exceptional $49,448 |
| Immigrants | Canada | 99.8 /100 | #69 | Exceptional $49,412 |
| Immigrants | Eastern Europe | 99.8 /100 | #70 | Exceptional $49,316 |
| Greeks | 99.8 /100 | #71 | Exceptional $49,309 |
Demographics Similar to Spanish Americans by Per Capita Income
In terms of per capita income, the demographic groups most similar to Spanish Americans are American ($39,039, a difference of 0.070%), Belizean ($39,097, a difference of 0.22%), Iroquois ($39,104, a difference of 0.23%), Marshallese ($39,108, a difference of 0.25%), and Alaskan Athabascan ($39,163, a difference of 0.39%).
| Demographics | Rating | Rank | Per Capita Income |
| Jamaicans | 0.7 /100 | #258 | Tragic $39,231 |
| Malaysians | 0.7 /100 | #259 | Tragic $39,194 |
| Alaskan Athabascans | 0.6 /100 | #260 | Tragic $39,163 |
| Marshallese | 0.6 /100 | #261 | Tragic $39,108 |
| Iroquois | 0.6 /100 | #262 | Tragic $39,104 |
| Belizeans | 0.6 /100 | #263 | Tragic $39,097 |
| Americans | 0.6 /100 | #264 | Tragic $39,039 |
| Spanish Americans | 0.5 /100 | #265 | Tragic $39,012 |
| Salvadorans | 0.5 /100 | #266 | Tragic $38,858 |
| Immigrants | Zaire | 0.4 /100 | #267 | Tragic $38,848 |
| Liberians | 0.4 /100 | #268 | Tragic $38,780 |
| Immigrants | Jamaica | 0.4 /100 | #269 | Tragic $38,766 |
| Immigrants | Belize | 0.3 /100 | #270 | Tragic $38,614 |
| Central Americans | 0.3 /100 | #271 | Tragic $38,560 |
| Immigrants | Cabo Verde | 0.3 /100 | #272 | Tragic $38,540 |