Immigrants from Argentina vs Immigrants from Nicaragua Median Earnings
COMPARE
Immigrants from Argentina
Immigrants from Nicaragua
Median Earnings
Median Earnings Comparison
Immigrants from Argentina
Immigrants from Nicaragua
$49,841
MEDIAN EARNINGS
99.2/ 100
METRIC RATING
92nd/ 347
METRIC RANK
$41,737
MEDIAN EARNINGS
0.1/ 100
METRIC RATING
285th/ 347
METRIC RANK
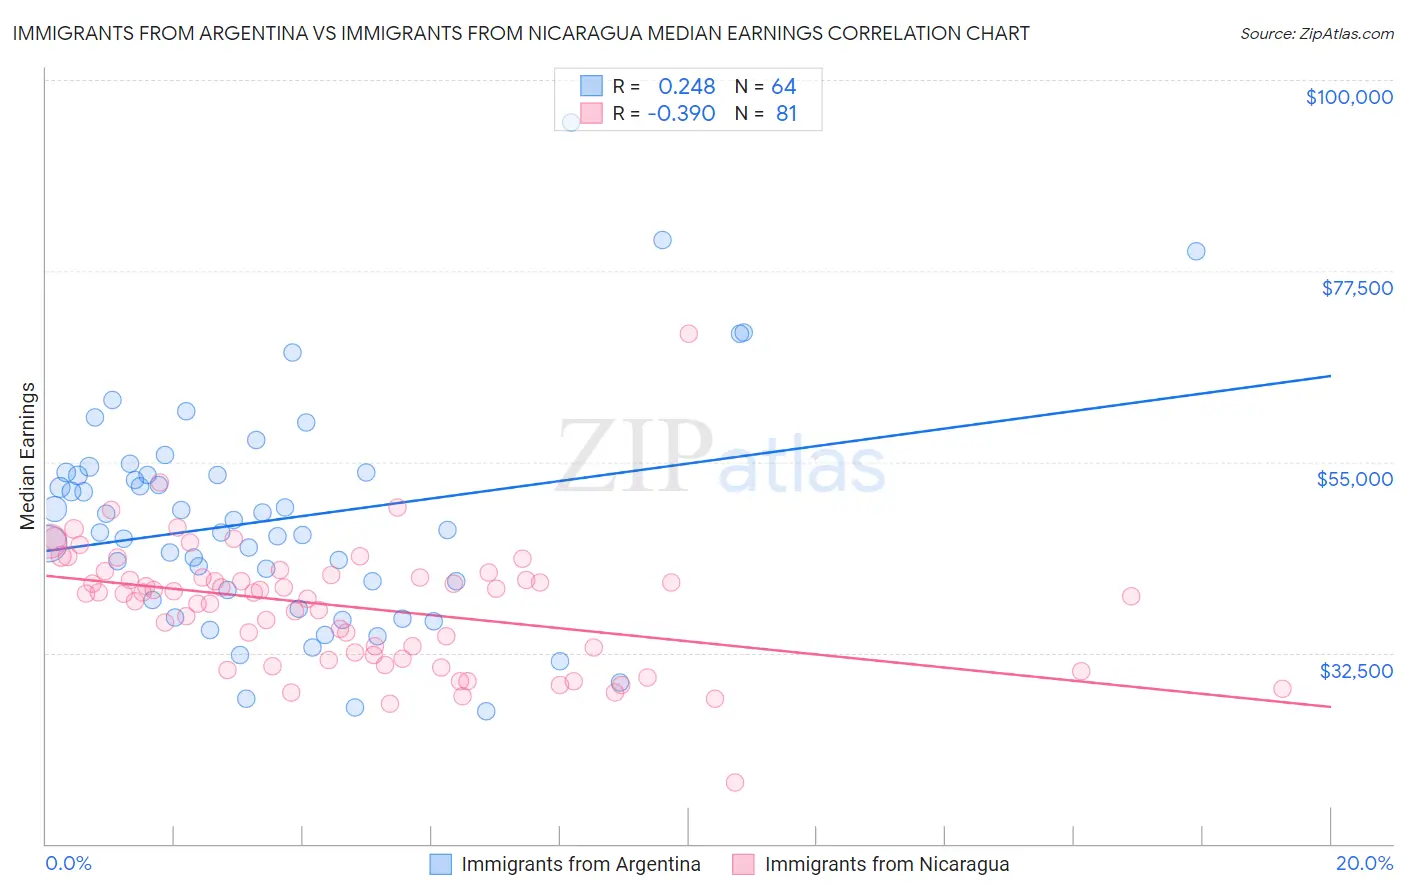
Immigrants from Argentina vs Immigrants from Nicaragua Median Earnings Correlation Chart
The statistical analysis conducted on geographies consisting of 264,409,503 people shows a weak positive correlation between the proportion of Immigrants from Argentina and median earnings in the United States with a correlation coefficient (R) of 0.248 and weighted average of $49,841. Similarly, the statistical analysis conducted on geographies consisting of 236,337,785 people shows a mild negative correlation between the proportion of Immigrants from Nicaragua and median earnings in the United States with a correlation coefficient (R) of -0.390 and weighted average of $41,737, a difference of 19.4%.
Median Earnings Correlation Summary
| Measurement | Immigrants from Argentina | Immigrants from Nicaragua |
| Minimum | $25,634 | $17,262 |
| Maximum | $94,961 | $70,084 |
| Range | $69,327 | $52,822 |
| Mean | $48,229 | $37,945 |
| Median | $46,837 | $39,498 |
| Interquartile 25% (IQ1) | $39,341 | $31,989 |
| Interquartile 75% (IQ3) | $53,567 | $41,525 |
| Interquartile Range (IQR) | $14,226 | $9,536 |
| Standard Deviation (Sample) | $13,180 | $7,439 |
| Standard Deviation (Population) | $13,077 | $7,393 |
Similar Demographics by Median Earnings
Demographics Similar to Immigrants from Argentina by Median Earnings
In terms of median earnings, the demographic groups most similar to Immigrants from Argentina are Armenian ($49,804, a difference of 0.070%), Macedonian ($49,893, a difference of 0.11%), Italian ($49,915, a difference of 0.15%), Croatian ($49,724, a difference of 0.23%), and Immigrants from England ($49,722, a difference of 0.24%).
| Demographics | Rating | Rank | Median Earnings |
| Immigrants | Kazakhstan | 99.5 /100 | #85 | Exceptional $50,225 |
| Immigrants | Canada | 99.5 /100 | #86 | Exceptional $50,192 |
| Immigrants | Uzbekistan | 99.5 /100 | #87 | Exceptional $50,151 |
| Albanians | 99.4 /100 | #88 | Exceptional $50,116 |
| Immigrants | North America | 99.4 /100 | #89 | Exceptional $50,108 |
| Italians | 99.3 /100 | #90 | Exceptional $49,915 |
| Macedonians | 99.2 /100 | #91 | Exceptional $49,893 |
| Immigrants | Argentina | 99.2 /100 | #92 | Exceptional $49,841 |
| Armenians | 99.1 /100 | #93 | Exceptional $49,804 |
| Croatians | 99.0 /100 | #94 | Exceptional $49,724 |
| Immigrants | England | 99.0 /100 | #95 | Exceptional $49,722 |
| Immigrants | Lebanon | 99.0 /100 | #96 | Exceptional $49,682 |
| Immigrants | North Macedonia | 98.9 /100 | #97 | Exceptional $49,658 |
| Immigrants | Northern Africa | 98.9 /100 | #98 | Exceptional $49,648 |
| Immigrants | Afghanistan | 98.9 /100 | #99 | Exceptional $49,645 |
Demographics Similar to Immigrants from Nicaragua by Median Earnings
In terms of median earnings, the demographic groups most similar to Immigrants from Nicaragua are Mexican American Indian ($41,719, a difference of 0.040%), Indonesian ($41,701, a difference of 0.090%), Blackfeet ($41,822, a difference of 0.20%), Dominican ($41,864, a difference of 0.31%), and Immigrants from Dominican Republic ($41,554, a difference of 0.44%).
| Demographics | Rating | Rank | Median Earnings |
| Cajuns | 0.3 /100 | #278 | Tragic $42,189 |
| Colville | 0.2 /100 | #279 | Tragic $42,151 |
| Hmong | 0.2 /100 | #280 | Tragic $42,111 |
| Marshallese | 0.2 /100 | #281 | Tragic $41,969 |
| Africans | 0.2 /100 | #282 | Tragic $41,955 |
| Dominicans | 0.2 /100 | #283 | Tragic $41,864 |
| Blackfeet | 0.2 /100 | #284 | Tragic $41,822 |
| Immigrants | Nicaragua | 0.1 /100 | #285 | Tragic $41,737 |
| Mexican American Indians | 0.1 /100 | #286 | Tragic $41,719 |
| Indonesians | 0.1 /100 | #287 | Tragic $41,701 |
| Immigrants | Dominican Republic | 0.1 /100 | #288 | Tragic $41,554 |
| Comanche | 0.1 /100 | #289 | Tragic $41,519 |
| Paiute | 0.1 /100 | #290 | Tragic $41,508 |
| Central American Indians | 0.1 /100 | #291 | Tragic $41,474 |
| U.S. Virgin Islanders | 0.1 /100 | #292 | Tragic $41,448 |