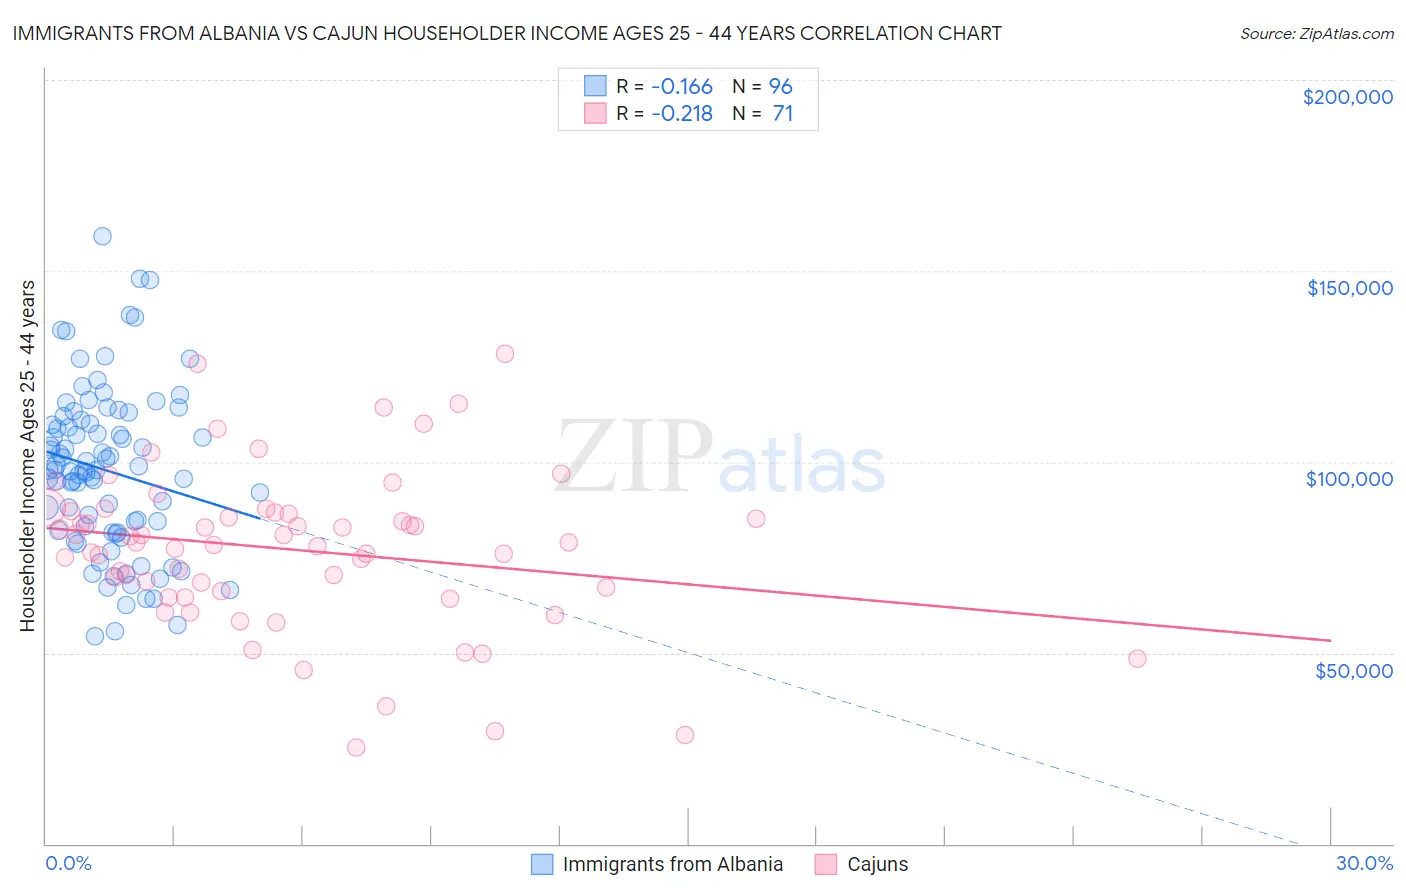
Immigrants from Albania vs Cajun Householder Income Ages 25 - 44 years
COMPARE
Immigrants from Albania
Cajun
Householder Income Ages 25 - 44 years
Householder Income Ages 25 - 44 years Comparison
Immigrants from Albania
Cajuns
$97,929
HOUSEHOLDER INCOME AGES 25 - 44 YEARS
86.6/ 100
METRIC RATING
131st/ 347
METRIC RANK
$82,393
HOUSEHOLDER INCOME AGES 25 - 44 YEARS
0.1/ 100
METRIC RATING
281st/ 347
METRIC RANK
Immigrants from Albania vs Cajun Householder Income Ages 25 - 44 years Correlation Chart
The statistical analysis conducted on geographies consisting of 119,323,359 people shows a poor negative correlation between the proportion of Immigrants from Albania and household income with householder between the ages 25 and 44 in the United States with a correlation coefficient (R) of -0.166 and weighted average of $97,929. Similarly, the statistical analysis conducted on geographies consisting of 149,428,991 people shows a weak negative correlation between the proportion of Cajuns and household income with householder between the ages 25 and 44 in the United States with a correlation coefficient (R) of -0.218 and weighted average of $82,393, a difference of 18.9%.
Householder Income Ages 25 - 44 years Correlation Summary
| Measurement | Immigrants from Albania | Cajun |
| Minimum | $54,306 | $25,321 |
| Maximum | $159,200 | $128,296 |
| Range | $104,894 | $102,975 |
| Mean | $97,705 | $77,078 |
| Median | $97,845 | $78,831 |
| Interquartile 25% (IQ1) | $81,795 | $66,250 |
| Interquartile 75% (IQ3) | $110,452 | $86,857 |
| Interquartile Range (IQR) | $28,657 | $20,607 |
| Standard Deviation (Sample) | $21,537 | $20,566 |
| Standard Deviation (Population) | $21,424 | $20,421 |
Similar Demographics by Householder Income Ages 25 - 44 years
Demographics Similar to Immigrants from Albania by Householder Income Ages 25 - 44 years
In terms of householder income ages 25 - 44 years, the demographic groups most similar to Immigrants from Albania are Immigrants from Zimbabwe ($97,880, a difference of 0.050%), Tsimshian ($97,809, a difference of 0.12%), Immigrants from Kuwait ($98,122, a difference of 0.20%), Canadian ($97,625, a difference of 0.31%), and Immigrants from Oceania ($97,623, a difference of 0.31%).
| Demographics | Rating | Rank | Householder Income Ages 25 - 44 years |
| Zimbabweans | 90.3 /100 | #124 | Exceptional $98,586 |
| Pakistanis | 89.3 /100 | #125 | Excellent $98,401 |
| British | 89.1 /100 | #126 | Excellent $98,359 |
| Serbians | 88.9 /100 | #127 | Excellent $98,320 |
| Europeans | 88.9 /100 | #128 | Excellent $98,310 |
| Brazilians | 88.6 /100 | #129 | Excellent $98,267 |
| Immigrants | Kuwait | 87.8 /100 | #130 | Excellent $98,122 |
| Immigrants | Albania | 86.6 /100 | #131 | Excellent $97,929 |
| Immigrants | Zimbabwe | 86.3 /100 | #132 | Excellent $97,880 |
| Tsimshian | 85.8 /100 | #133 | Excellent $97,809 |
| Canadians | 84.5 /100 | #134 | Excellent $97,625 |
| Immigrants | Oceania | 84.5 /100 | #135 | Excellent $97,623 |
| Hungarians | 83.9 /100 | #136 | Excellent $97,544 |
| Lebanese | 82.3 /100 | #137 | Excellent $97,339 |
| Arabs | 82.3 /100 | #138 | Excellent $97,336 |
Demographics Similar to Cajuns by Householder Income Ages 25 - 44 years
In terms of householder income ages 25 - 44 years, the demographic groups most similar to Cajuns are Central American Indian ($82,355, a difference of 0.050%), Guatemalan ($82,331, a difference of 0.070%), Immigrants from Middle Africa ($82,254, a difference of 0.17%), Immigrants from Somalia ($82,188, a difference of 0.25%), and Colville ($82,604, a difference of 0.26%).
| Demographics | Rating | Rank | Householder Income Ages 25 - 44 years |
| Marshallese | 0.2 /100 | #274 | Tragic $83,575 |
| Immigrants | Jamaica | 0.2 /100 | #275 | Tragic $83,298 |
| Immigrants | Belize | 0.2 /100 | #276 | Tragic $83,141 |
| Paiute | 0.2 /100 | #277 | Tragic $82,984 |
| Senegalese | 0.2 /100 | #278 | Tragic $82,852 |
| Pima | 0.1 /100 | #279 | Tragic $82,821 |
| Colville | 0.1 /100 | #280 | Tragic $82,604 |
| Cajuns | 0.1 /100 | #281 | Tragic $82,393 |
| Central American Indians | 0.1 /100 | #282 | Tragic $82,355 |
| Guatemalans | 0.1 /100 | #283 | Tragic $82,331 |
| Immigrants | Middle Africa | 0.1 /100 | #284 | Tragic $82,254 |
| Immigrants | Somalia | 0.1 /100 | #285 | Tragic $82,188 |
| Ute | 0.1 /100 | #286 | Tragic $82,166 |
| Immigrants | Latin America | 0.1 /100 | #287 | Tragic $82,166 |
| Comanche | 0.1 /100 | #288 | Tragic $82,152 |