Immigrants from Albania vs Cree Householder Income Ages 25 - 44 years
COMPARE
Immigrants from Albania
Cree
Householder Income Ages 25 - 44 years
Householder Income Ages 25 - 44 years Comparison
Immigrants from Albania
Cree
$97,929
HOUSEHOLDER INCOME AGES 25 - 44 YEARS
86.6/ 100
METRIC RATING
131st/ 347
METRIC RANK
$84,574
HOUSEHOLDER INCOME AGES 25 - 44 YEARS
0.4/ 100
METRIC RATING
262nd/ 347
METRIC RANK
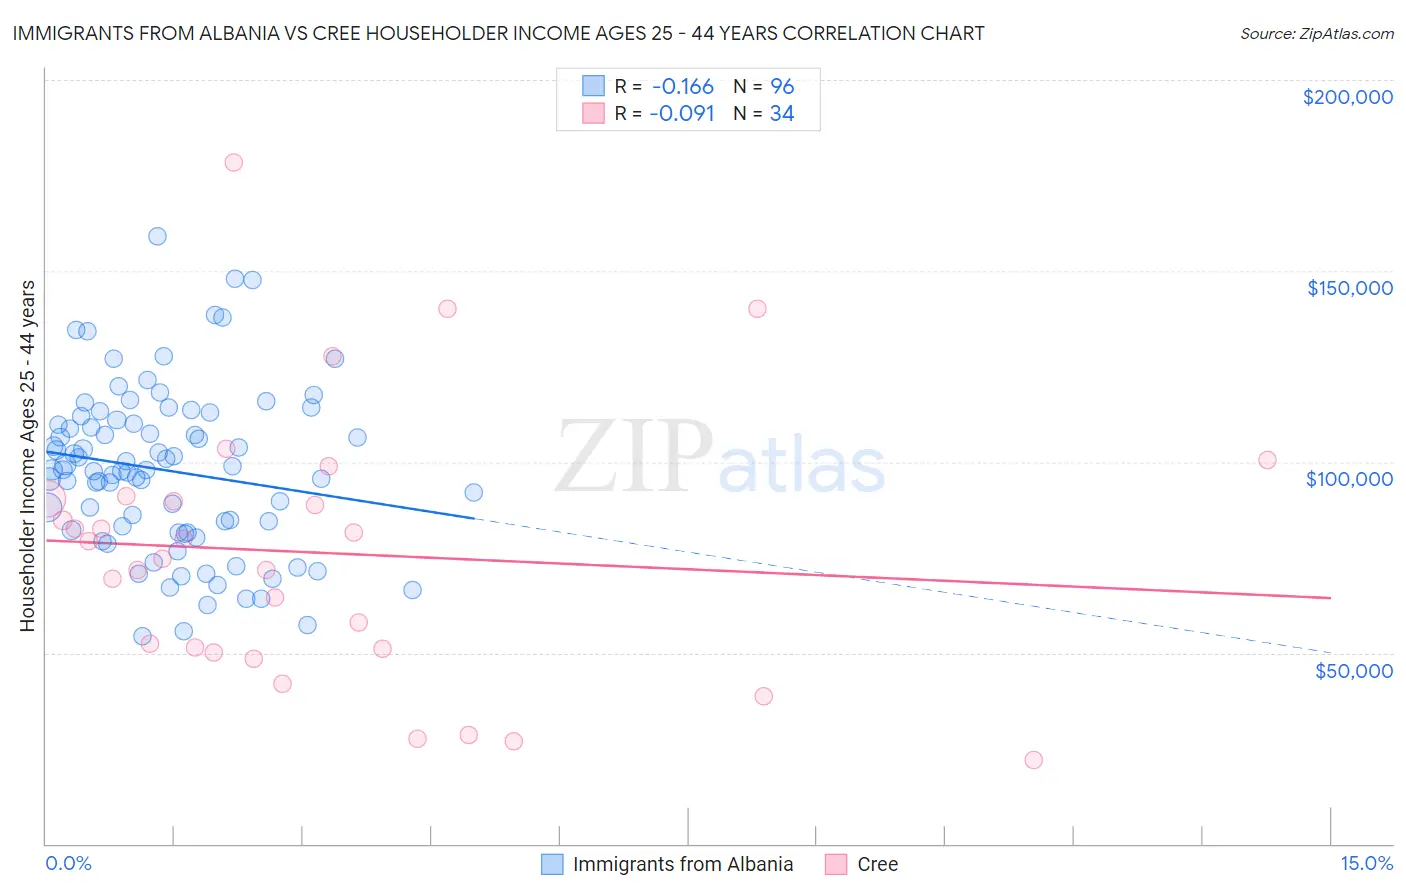
Immigrants from Albania vs Cree Householder Income Ages 25 - 44 years Correlation Chart
The statistical analysis conducted on geographies consisting of 119,323,359 people shows a poor negative correlation between the proportion of Immigrants from Albania and household income with householder between the ages 25 and 44 in the United States with a correlation coefficient (R) of -0.166 and weighted average of $97,929. Similarly, the statistical analysis conducted on geographies consisting of 76,153,555 people shows a slight negative correlation between the proportion of Cree and household income with householder between the ages 25 and 44 in the United States with a correlation coefficient (R) of -0.091 and weighted average of $84,574, a difference of 15.8%.
Householder Income Ages 25 - 44 years Correlation Summary
| Measurement | Immigrants from Albania | Cree |
| Minimum | $54,306 | $22,083 |
| Maximum | $159,200 | $178,304 |
| Range | $104,894 | $156,221 |
| Mean | $97,705 | $76,111 |
| Median | $97,845 | $76,790 |
| Interquartile 25% (IQ1) | $81,795 | $50,987 |
| Interquartile 75% (IQ3) | $110,452 | $90,298 |
| Interquartile Range (IQR) | $28,657 | $39,311 |
| Standard Deviation (Sample) | $21,537 | $35,026 |
| Standard Deviation (Population) | $21,424 | $34,507 |
Similar Demographics by Householder Income Ages 25 - 44 years
Demographics Similar to Immigrants from Albania by Householder Income Ages 25 - 44 years
In terms of householder income ages 25 - 44 years, the demographic groups most similar to Immigrants from Albania are Immigrants from Zimbabwe ($97,880, a difference of 0.050%), Tsimshian ($97,809, a difference of 0.12%), Immigrants from Kuwait ($98,122, a difference of 0.20%), Canadian ($97,625, a difference of 0.31%), and Immigrants from Oceania ($97,623, a difference of 0.31%).
| Demographics | Rating | Rank | Householder Income Ages 25 - 44 years |
| Zimbabweans | 90.3 /100 | #124 | Exceptional $98,586 |
| Pakistanis | 89.3 /100 | #125 | Excellent $98,401 |
| British | 89.1 /100 | #126 | Excellent $98,359 |
| Serbians | 88.9 /100 | #127 | Excellent $98,320 |
| Europeans | 88.9 /100 | #128 | Excellent $98,310 |
| Brazilians | 88.6 /100 | #129 | Excellent $98,267 |
| Immigrants | Kuwait | 87.8 /100 | #130 | Excellent $98,122 |
| Immigrants | Albania | 86.6 /100 | #131 | Excellent $97,929 |
| Immigrants | Zimbabwe | 86.3 /100 | #132 | Excellent $97,880 |
| Tsimshian | 85.8 /100 | #133 | Excellent $97,809 |
| Canadians | 84.5 /100 | #134 | Excellent $97,625 |
| Immigrants | Oceania | 84.5 /100 | #135 | Excellent $97,623 |
| Hungarians | 83.9 /100 | #136 | Excellent $97,544 |
| Lebanese | 82.3 /100 | #137 | Excellent $97,339 |
| Arabs | 82.3 /100 | #138 | Excellent $97,336 |
Demographics Similar to Cree by Householder Income Ages 25 - 44 years
In terms of householder income ages 25 - 44 years, the demographic groups most similar to Cree are Inupiat ($84,619, a difference of 0.050%), Belizean ($84,534, a difference of 0.050%), Osage ($84,461, a difference of 0.13%), Sudanese ($84,401, a difference of 0.20%), and American ($84,791, a difference of 0.26%).
| Demographics | Rating | Rank | Householder Income Ages 25 - 44 years |
| German Russians | 0.6 /100 | #255 | Tragic $85,220 |
| Central Americans | 0.5 /100 | #256 | Tragic $85,144 |
| Mexican American Indians | 0.5 /100 | #257 | Tragic $85,066 |
| Immigrants | Nicaragua | 0.5 /100 | #258 | Tragic $84,914 |
| Immigrants | Senegal | 0.5 /100 | #259 | Tragic $84,848 |
| Americans | 0.4 /100 | #260 | Tragic $84,791 |
| Inupiat | 0.4 /100 | #261 | Tragic $84,619 |
| Cree | 0.4 /100 | #262 | Tragic $84,574 |
| Belizeans | 0.4 /100 | #263 | Tragic $84,534 |
| Osage | 0.4 /100 | #264 | Tragic $84,461 |
| Sudanese | 0.4 /100 | #265 | Tragic $84,401 |
| Immigrants | Cabo Verde | 0.3 /100 | #266 | Tragic $84,304 |
| Hmong | 0.3 /100 | #267 | Tragic $84,258 |
| Sub-Saharan Africans | 0.3 /100 | #268 | Tragic $84,235 |
| Spanish American Indians | 0.3 /100 | #269 | Tragic $84,085 |