Dutch West Indian vs Cape Verdean Householder Income Ages 25 - 44 years
COMPARE
Dutch West Indian
Cape Verdean
Householder Income Ages 25 - 44 years
Householder Income Ages 25 - 44 years Comparison
Dutch West Indians
Cape Verdeans
$77,260
HOUSEHOLDER INCOME AGES 25 - 44 YEARS
0.0/ 100
METRIC RATING
324th/ 347
METRIC RANK
$85,758
HOUSEHOLDER INCOME AGES 25 - 44 YEARS
0.8/ 100
METRIC RATING
251st/ 347
METRIC RANK
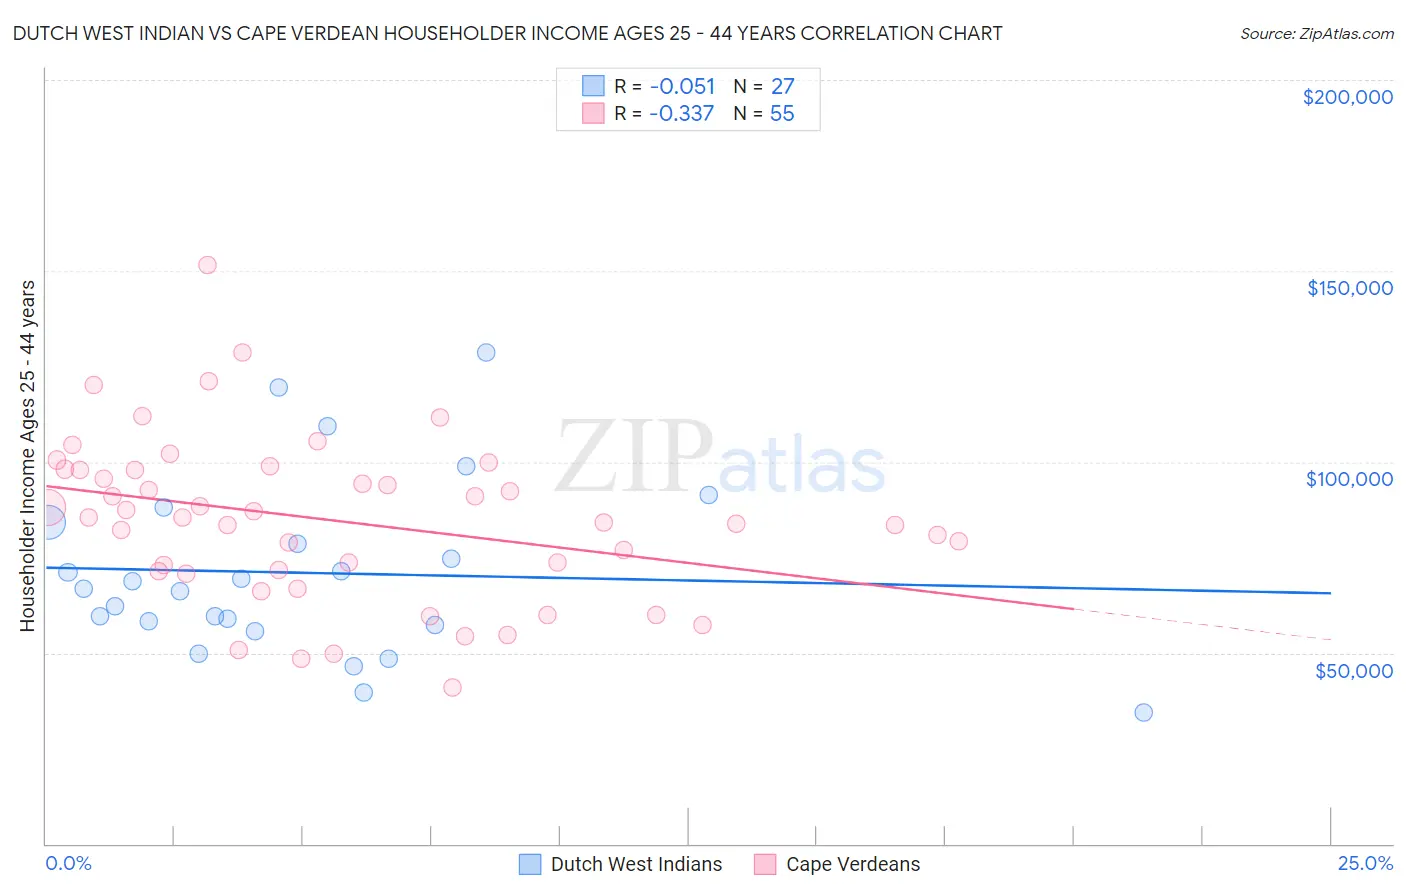
Dutch West Indian vs Cape Verdean Householder Income Ages 25 - 44 years Correlation Chart
The statistical analysis conducted on geographies consisting of 85,685,681 people shows a slight negative correlation between the proportion of Dutch West Indians and household income with householder between the ages 25 and 44 in the United States with a correlation coefficient (R) of -0.051 and weighted average of $77,260. Similarly, the statistical analysis conducted on geographies consisting of 107,474,022 people shows a mild negative correlation between the proportion of Cape Verdeans and household income with householder between the ages 25 and 44 in the United States with a correlation coefficient (R) of -0.337 and weighted average of $85,758, a difference of 11.0%.
Householder Income Ages 25 - 44 years Correlation Summary
| Measurement | Dutch West Indian | Cape Verdean |
| Minimum | $34,250 | $41,033 |
| Maximum | $128,750 | $151,693 |
| Range | $94,500 | $110,660 |
| Mean | $70,946 | $84,702 |
| Median | $66,805 | $85,334 |
| Interquartile 25% (IQ1) | $57,188 | $71,313 |
| Interquartile 75% (IQ3) | $84,121 | $97,942 |
| Interquartile Range (IQR) | $26,933 | $26,629 |
| Standard Deviation (Sample) | $23,101 | $21,551 |
| Standard Deviation (Population) | $22,670 | $21,354 |
Similar Demographics by Householder Income Ages 25 - 44 years
Demographics Similar to Dutch West Indians by Householder Income Ages 25 - 44 years
In terms of householder income ages 25 - 44 years, the demographic groups most similar to Dutch West Indians are Immigrants from Honduras ($77,328, a difference of 0.090%), Sioux ($77,089, a difference of 0.22%), Houma ($77,044, a difference of 0.28%), Immigrants from Bahamas ($76,910, a difference of 0.46%), and Immigrants from Cuba ($76,701, a difference of 0.73%).
| Demographics | Rating | Rank | Householder Income Ages 25 - 44 years |
| U.S. Virgin Islanders | 0.0 /100 | #317 | Tragic $78,911 |
| Immigrants | Mexico | 0.0 /100 | #318 | Tragic $78,809 |
| Hondurans | 0.0 /100 | #319 | Tragic $78,540 |
| Choctaw | 0.0 /100 | #320 | Tragic $78,168 |
| Immigrants | Zaire | 0.0 /100 | #321 | Tragic $78,045 |
| Chickasaw | 0.0 /100 | #322 | Tragic $77,929 |
| Immigrants | Honduras | 0.0 /100 | #323 | Tragic $77,328 |
| Dutch West Indians | 0.0 /100 | #324 | Tragic $77,260 |
| Sioux | 0.0 /100 | #325 | Tragic $77,089 |
| Houma | 0.0 /100 | #326 | Tragic $77,044 |
| Immigrants | Bahamas | 0.0 /100 | #327 | Tragic $76,910 |
| Immigrants | Cuba | 0.0 /100 | #328 | Tragic $76,701 |
| Seminole | 0.0 /100 | #329 | Tragic $76,584 |
| Yakama | 0.0 /100 | #330 | Tragic $76,226 |
| Natives/Alaskans | 0.0 /100 | #331 | Tragic $75,647 |
Demographics Similar to Cape Verdeans by Householder Income Ages 25 - 44 years
In terms of householder income ages 25 - 44 years, the demographic groups most similar to Cape Verdeans are Pennsylvania German ($85,836, a difference of 0.090%), Immigrants from Western Africa ($85,676, a difference of 0.10%), French American Indian ($85,899, a difference of 0.16%), British West Indian ($85,565, a difference of 0.23%), and Immigrants from Laos ($85,553, a difference of 0.24%).
| Demographics | Rating | Rank | Householder Income Ages 25 - 44 years |
| Immigrants | Venezuela | 1.5 /100 | #244 | Tragic $87,038 |
| Immigrants | El Salvador | 1.4 /100 | #245 | Tragic $86,913 |
| Immigrants | Burma/Myanmar | 1.3 /100 | #246 | Tragic $86,736 |
| Immigrants | Nigeria | 1.2 /100 | #247 | Tragic $86,589 |
| Immigrants | Sudan | 0.9 /100 | #248 | Tragic $86,109 |
| French American Indians | 0.8 /100 | #249 | Tragic $85,899 |
| Pennsylvania Germans | 0.8 /100 | #250 | Tragic $85,836 |
| Cape Verdeans | 0.8 /100 | #251 | Tragic $85,758 |
| Immigrants | Western Africa | 0.7 /100 | #252 | Tragic $85,676 |
| British West Indians | 0.7 /100 | #253 | Tragic $85,565 |
| Immigrants | Laos | 0.7 /100 | #254 | Tragic $85,553 |
| German Russians | 0.6 /100 | #255 | Tragic $85,220 |
| Central Americans | 0.5 /100 | #256 | Tragic $85,144 |
| Mexican American Indians | 0.5 /100 | #257 | Tragic $85,066 |
| Immigrants | Nicaragua | 0.5 /100 | #258 | Tragic $84,914 |