Immigrants from Bahamas vs Cape Verdean Householder Income Ages 25 - 44 years
COMPARE
Immigrants from Bahamas
Cape Verdean
Householder Income Ages 25 - 44 years
Householder Income Ages 25 - 44 years Comparison
Immigrants from Bahamas
Cape Verdeans
$76,910
HOUSEHOLDER INCOME AGES 25 - 44 YEARS
0.0/ 100
METRIC RATING
327th/ 347
METRIC RANK
$85,758
HOUSEHOLDER INCOME AGES 25 - 44 YEARS
0.8/ 100
METRIC RATING
251st/ 347
METRIC RANK
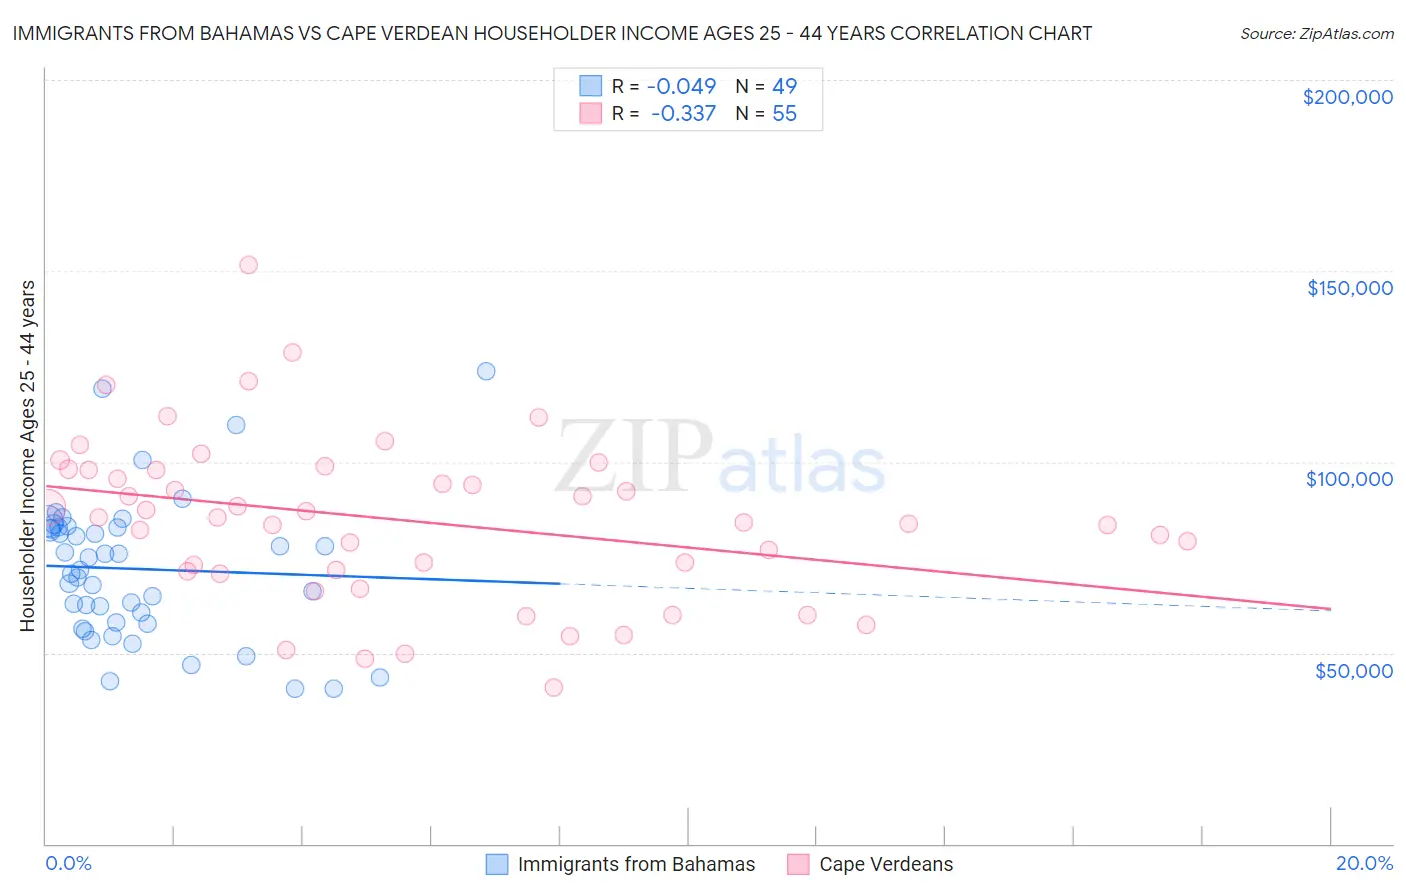
Immigrants from Bahamas vs Cape Verdean Householder Income Ages 25 - 44 years Correlation Chart
The statistical analysis conducted on geographies consisting of 104,540,789 people shows no correlation between the proportion of Immigrants from Bahamas and household income with householder between the ages 25 and 44 in the United States with a correlation coefficient (R) of -0.049 and weighted average of $76,910. Similarly, the statistical analysis conducted on geographies consisting of 107,474,022 people shows a mild negative correlation between the proportion of Cape Verdeans and household income with householder between the ages 25 and 44 in the United States with a correlation coefficient (R) of -0.337 and weighted average of $85,758, a difference of 11.5%.
Householder Income Ages 25 - 44 years Correlation Summary
| Measurement | Immigrants from Bahamas | Cape Verdean |
| Minimum | $40,456 | $41,033 |
| Maximum | $123,699 | $151,693 |
| Range | $83,243 | $110,660 |
| Mean | $71,953 | $84,702 |
| Median | $71,583 | $85,334 |
| Interquartile 25% (IQ1) | $57,810 | $71,313 |
| Interquartile 75% (IQ3) | $82,867 | $97,942 |
| Interquartile Range (IQR) | $25,057 | $26,629 |
| Standard Deviation (Sample) | $18,615 | $21,551 |
| Standard Deviation (Population) | $18,424 | $21,354 |
Similar Demographics by Householder Income Ages 25 - 44 years
Demographics Similar to Immigrants from Bahamas by Householder Income Ages 25 - 44 years
In terms of householder income ages 25 - 44 years, the demographic groups most similar to Immigrants from Bahamas are Houma ($77,044, a difference of 0.17%), Sioux ($77,089, a difference of 0.23%), Immigrants from Cuba ($76,701, a difference of 0.27%), Seminole ($76,584, a difference of 0.42%), and Dutch West Indian ($77,260, a difference of 0.46%).
| Demographics | Rating | Rank | Householder Income Ages 25 - 44 years |
| Choctaw | 0.0 /100 | #320 | Tragic $78,168 |
| Immigrants | Zaire | 0.0 /100 | #321 | Tragic $78,045 |
| Chickasaw | 0.0 /100 | #322 | Tragic $77,929 |
| Immigrants | Honduras | 0.0 /100 | #323 | Tragic $77,328 |
| Dutch West Indians | 0.0 /100 | #324 | Tragic $77,260 |
| Sioux | 0.0 /100 | #325 | Tragic $77,089 |
| Houma | 0.0 /100 | #326 | Tragic $77,044 |
| Immigrants | Bahamas | 0.0 /100 | #327 | Tragic $76,910 |
| Immigrants | Cuba | 0.0 /100 | #328 | Tragic $76,701 |
| Seminole | 0.0 /100 | #329 | Tragic $76,584 |
| Yakama | 0.0 /100 | #330 | Tragic $76,226 |
| Natives/Alaskans | 0.0 /100 | #331 | Tragic $75,647 |
| Bahamians | 0.0 /100 | #332 | Tragic $75,395 |
| Hopi | 0.0 /100 | #333 | Tragic $75,002 |
| Creek | 0.0 /100 | #334 | Tragic $74,847 |
Demographics Similar to Cape Verdeans by Householder Income Ages 25 - 44 years
In terms of householder income ages 25 - 44 years, the demographic groups most similar to Cape Verdeans are Pennsylvania German ($85,836, a difference of 0.090%), Immigrants from Western Africa ($85,676, a difference of 0.10%), French American Indian ($85,899, a difference of 0.16%), British West Indian ($85,565, a difference of 0.23%), and Immigrants from Laos ($85,553, a difference of 0.24%).
| Demographics | Rating | Rank | Householder Income Ages 25 - 44 years |
| Immigrants | Venezuela | 1.5 /100 | #244 | Tragic $87,038 |
| Immigrants | El Salvador | 1.4 /100 | #245 | Tragic $86,913 |
| Immigrants | Burma/Myanmar | 1.3 /100 | #246 | Tragic $86,736 |
| Immigrants | Nigeria | 1.2 /100 | #247 | Tragic $86,589 |
| Immigrants | Sudan | 0.9 /100 | #248 | Tragic $86,109 |
| French American Indians | 0.8 /100 | #249 | Tragic $85,899 |
| Pennsylvania Germans | 0.8 /100 | #250 | Tragic $85,836 |
| Cape Verdeans | 0.8 /100 | #251 | Tragic $85,758 |
| Immigrants | Western Africa | 0.7 /100 | #252 | Tragic $85,676 |
| British West Indians | 0.7 /100 | #253 | Tragic $85,565 |
| Immigrants | Laos | 0.7 /100 | #254 | Tragic $85,553 |
| German Russians | 0.6 /100 | #255 | Tragic $85,220 |
| Central Americans | 0.5 /100 | #256 | Tragic $85,144 |
| Mexican American Indians | 0.5 /100 | #257 | Tragic $85,066 |
| Immigrants | Nicaragua | 0.5 /100 | #258 | Tragic $84,914 |