Immigrants from Africa vs Immigrants from Costa Rica Householder Income Ages 25 - 44 years
COMPARE
Immigrants from Africa
Immigrants from Costa Rica
Householder Income Ages 25 - 44 years
Householder Income Ages 25 - 44 years Comparison
Immigrants from Africa
Immigrants from Costa Rica
$90,372
HOUSEHOLDER INCOME AGES 25 - 44 YEARS
8.9/ 100
METRIC RATING
214th/ 347
METRIC RANK
$92,876
HOUSEHOLDER INCOME AGES 25 - 44 YEARS
28.2/ 100
METRIC RATING
192nd/ 347
METRIC RANK
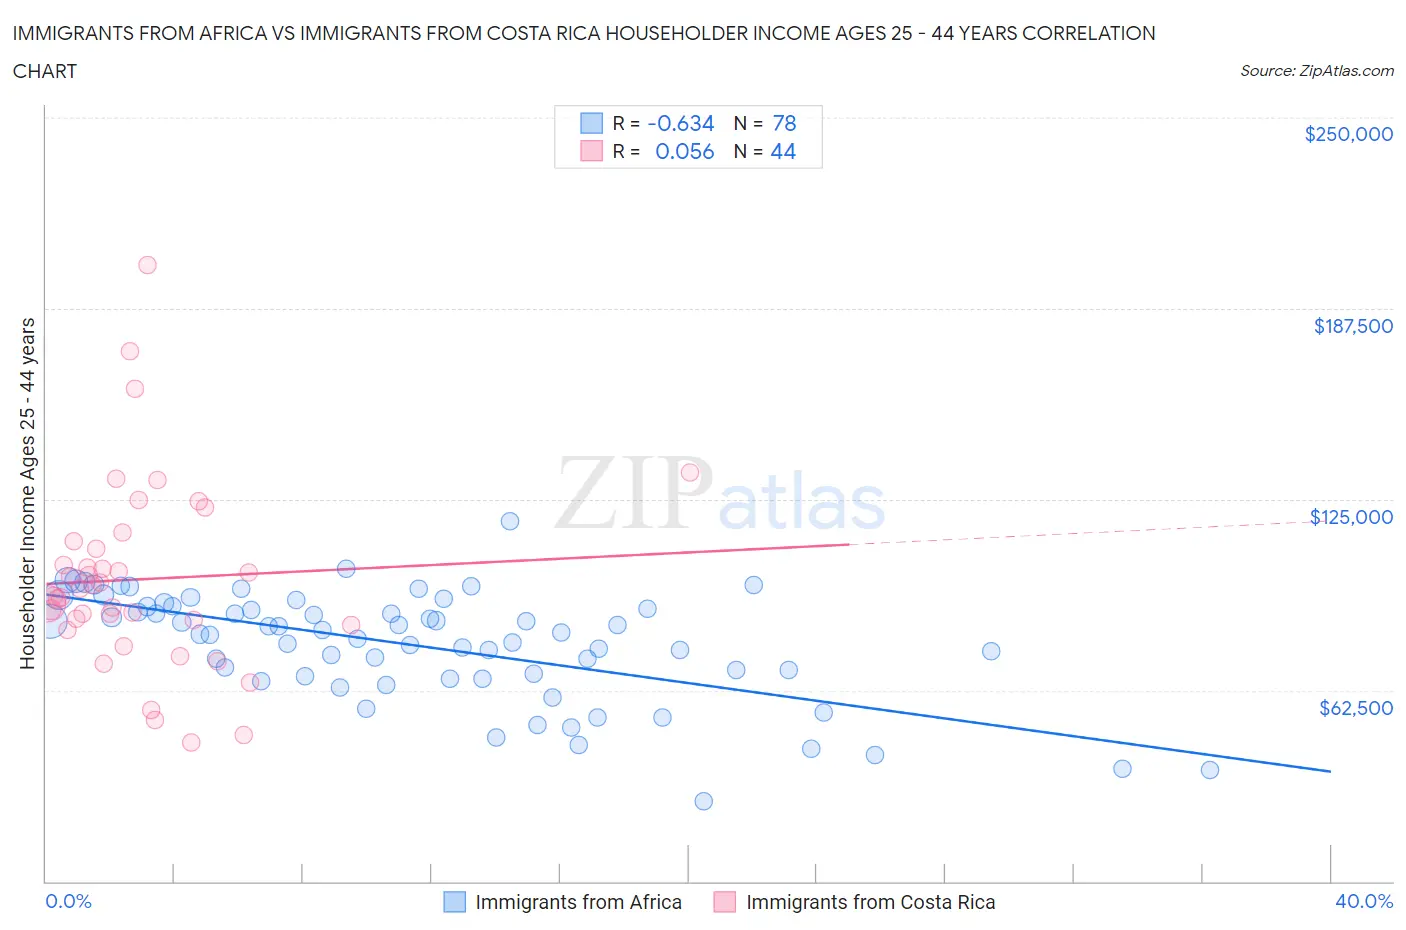
Immigrants from Africa vs Immigrants from Costa Rica Householder Income Ages 25 - 44 years Correlation Chart
The statistical analysis conducted on geographies consisting of 467,630,423 people shows a significant negative correlation between the proportion of Immigrants from Africa and household income with householder between the ages 25 and 44 in the United States with a correlation coefficient (R) of -0.634 and weighted average of $90,372. Similarly, the statistical analysis conducted on geographies consisting of 204,048,993 people shows a slight positive correlation between the proportion of Immigrants from Costa Rica and household income with householder between the ages 25 and 44 in the United States with a correlation coefficient (R) of 0.056 and weighted average of $92,876, a difference of 2.8%.
Householder Income Ages 25 - 44 years Correlation Summary
| Measurement | Immigrants from Africa | Immigrants from Costa Rica |
| Minimum | $26,250 | $45,556 |
| Maximum | $117,804 | $201,608 |
| Range | $91,554 | $156,052 |
| Mean | $77,244 | $98,859 |
| Median | $81,060 | $94,496 |
| Interquartile 25% (IQ1) | $67,103 | $84,714 |
| Interquartile 75% (IQ3) | $89,908 | $110,006 |
| Interquartile Range (IQR) | $22,805 | $25,292 |
| Standard Deviation (Sample) | $17,876 | $30,715 |
| Standard Deviation (Population) | $17,761 | $30,364 |
Similar Demographics by Householder Income Ages 25 - 44 years
Demographics Similar to Immigrants from Africa by Householder Income Ages 25 - 44 years
In terms of householder income ages 25 - 44 years, the demographic groups most similar to Immigrants from Africa are Immigrants from Bangladesh ($90,448, a difference of 0.090%), Panamanian ($90,193, a difference of 0.20%), Ghanaian ($90,137, a difference of 0.26%), Hawaiian ($90,722, a difference of 0.39%), and Iraqi ($90,764, a difference of 0.43%).
| Demographics | Rating | Rank | Householder Income Ages 25 - 44 years |
| Yugoslavians | 14.5 /100 | #207 | Poor $91,368 |
| Immigrants | Thailand | 14.3 /100 | #208 | Poor $91,337 |
| Immigrants | Uruguay | 13.2 /100 | #209 | Poor $91,171 |
| Immigrants | Kenya | 10.9 /100 | #210 | Poor $90,767 |
| Iraqis | 10.8 /100 | #211 | Poor $90,764 |
| Hawaiians | 10.6 /100 | #212 | Poor $90,722 |
| Immigrants | Bangladesh | 9.3 /100 | #213 | Tragic $90,448 |
| Immigrants | Africa | 8.9 /100 | #214 | Tragic $90,372 |
| Panamanians | 8.1 /100 | #215 | Tragic $90,193 |
| Ghanaians | 7.9 /100 | #216 | Tragic $90,137 |
| Scotch-Irish | 7.3 /100 | #217 | Tragic $89,969 |
| Guyanese | 7.1 /100 | #218 | Tragic $89,940 |
| Delaware | 6.9 /100 | #219 | Tragic $89,876 |
| Trinidadians and Tobagonians | 6.8 /100 | #220 | Tragic $89,856 |
| Immigrants | Trinidad and Tobago | 6.5 /100 | #221 | Tragic $89,748 |
Demographics Similar to Immigrants from Costa Rica by Householder Income Ages 25 - 44 years
In terms of householder income ages 25 - 44 years, the demographic groups most similar to Immigrants from Costa Rica are Tlingit-Haida ($92,987, a difference of 0.12%), Welsh ($93,039, a difference of 0.18%), Dutch ($93,081, a difference of 0.22%), Immigrants from Sierra Leone ($93,115, a difference of 0.26%), and Spaniard ($93,366, a difference of 0.53%).
| Demographics | Rating | Rank | Householder Income Ages 25 - 44 years |
| Immigrants | Eritrea | 35.2 /100 | #185 | Fair $93,466 |
| Sierra Leoneans | 34.8 /100 | #186 | Fair $93,435 |
| Spaniards | 34.0 /100 | #187 | Fair $93,366 |
| Immigrants | Sierra Leone | 30.9 /100 | #188 | Fair $93,115 |
| Dutch | 30.5 /100 | #189 | Fair $93,081 |
| Welsh | 30.0 /100 | #190 | Fair $93,039 |
| Tlingit-Haida | 29.4 /100 | #191 | Fair $92,987 |
| Immigrants | Costa Rica | 28.2 /100 | #192 | Fair $92,876 |
| Samoans | 23.0 /100 | #193 | Fair $92,385 |
| Immigrants | Azores | 22.4 /100 | #194 | Fair $92,322 |
| Celtics | 21.6 /100 | #195 | Fair $92,241 |
| Immigrants | Colombia | 21.3 /100 | #196 | Fair $92,204 |
| Spanish | 21.2 /100 | #197 | Fair $92,200 |
| Vietnamese | 20.2 /100 | #198 | Fair $92,089 |
| Kenyans | 16.8 /100 | #199 | Poor $91,684 |