Costa Rican vs Immigrants from Costa Rica Householder Income Ages 25 - 44 years
COMPARE
Costa Rican
Immigrants from Costa Rica
Householder Income Ages 25 - 44 years
Householder Income Ages 25 - 44 years Comparison
Costa Ricans
Immigrants from Costa Rica
$95,565
HOUSEHOLDER INCOME AGES 25 - 44 YEARS
63.5/ 100
METRIC RATING
159th/ 347
METRIC RANK
$92,876
HOUSEHOLDER INCOME AGES 25 - 44 YEARS
28.2/ 100
METRIC RATING
192nd/ 347
METRIC RANK
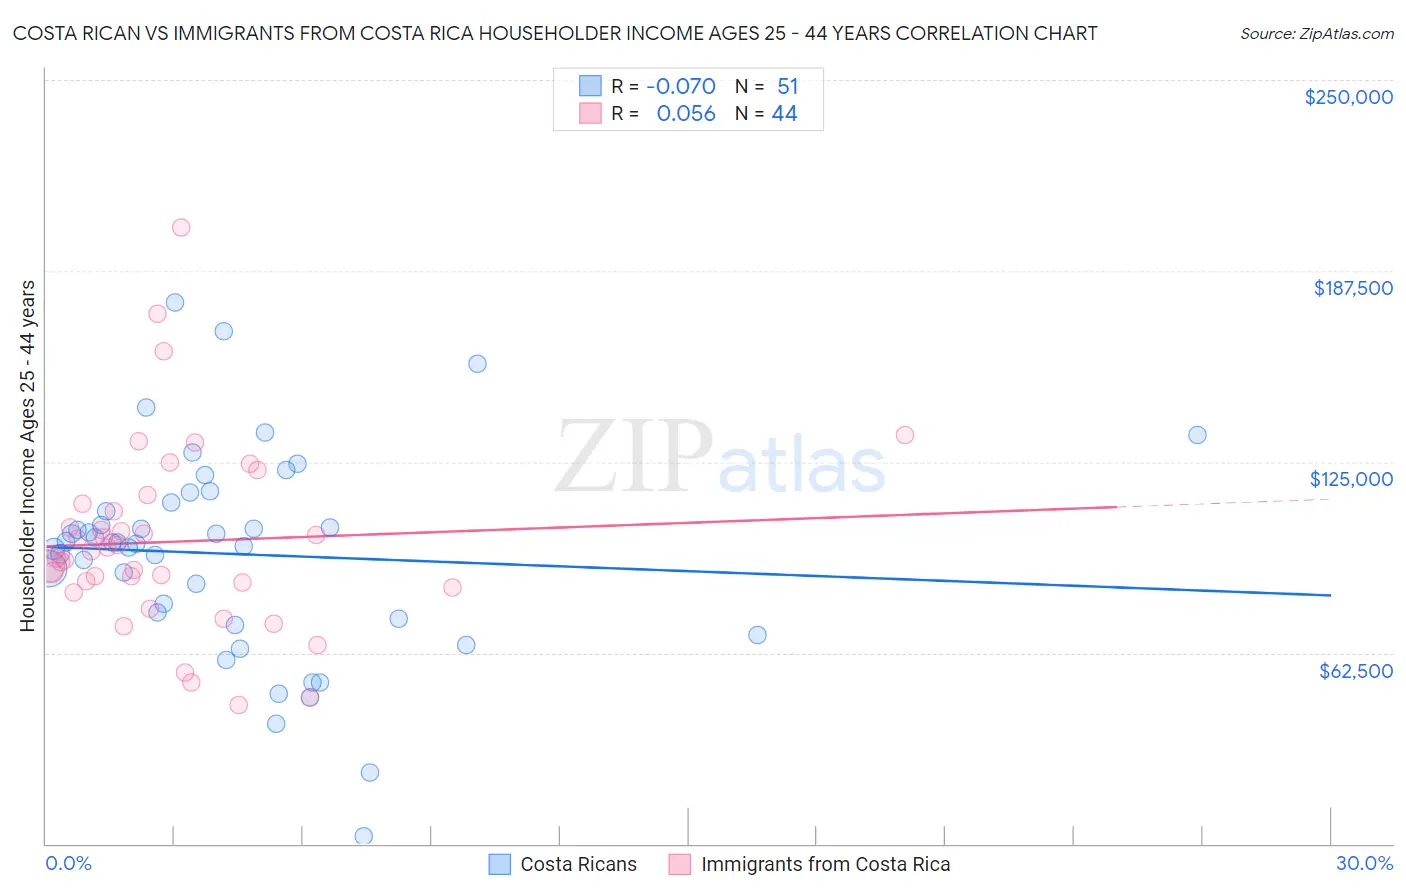
Costa Rican vs Immigrants from Costa Rica Householder Income Ages 25 - 44 years Correlation Chart
The statistical analysis conducted on geographies consisting of 253,116,835 people shows a slight negative correlation between the proportion of Costa Ricans and household income with householder between the ages 25 and 44 in the United States with a correlation coefficient (R) of -0.070 and weighted average of $95,565. Similarly, the statistical analysis conducted on geographies consisting of 204,048,993 people shows a slight positive correlation between the proportion of Immigrants from Costa Rica and household income with householder between the ages 25 and 44 in the United States with a correlation coefficient (R) of 0.056 and weighted average of $92,876, a difference of 2.9%.
Householder Income Ages 25 - 44 years Correlation Summary
| Measurement | Costa Rican | Immigrants from Costa Rica |
| Minimum | $2,499 | $45,556 |
| Maximum | $177,312 | $201,608 |
| Range | $174,813 | $156,052 |
| Mean | $94,845 | $98,859 |
| Median | $98,440 | $94,496 |
| Interquartile 25% (IQ1) | $73,523 | $84,714 |
| Interquartile 75% (IQ3) | $111,609 | $110,006 |
| Interquartile Range (IQR) | $38,086 | $25,292 |
| Standard Deviation (Sample) | $33,692 | $30,715 |
| Standard Deviation (Population) | $33,360 | $30,364 |
Similar Demographics by Householder Income Ages 25 - 44 years
Demographics Similar to Costa Ricans by Householder Income Ages 25 - 44 years
In terms of householder income ages 25 - 44 years, the demographic groups most similar to Costa Ricans are Icelander ($95,560, a difference of 0.010%), Scandinavian ($95,596, a difference of 0.030%), Immigrants from Portugal ($95,512, a difference of 0.060%), Swiss ($95,511, a difference of 0.060%), and Immigrants from Saudi Arabia ($95,450, a difference of 0.12%).
| Demographics | Rating | Rank | Householder Income Ages 25 - 44 years |
| South American Indians | 74.5 /100 | #152 | Good $96,497 |
| Slovenes | 73.9 /100 | #153 | Good $96,439 |
| Slavs | 73.2 /100 | #154 | Good $96,377 |
| Moroccans | 70.3 /100 | #155 | Good $96,117 |
| Immigrants | Germany | 67.9 /100 | #156 | Good $95,913 |
| Immigrants | Uganda | 65.2 /100 | #157 | Good $95,698 |
| Scandinavians | 63.9 /100 | #158 | Good $95,596 |
| Costa Ricans | 63.5 /100 | #159 | Good $95,565 |
| Icelanders | 63.4 /100 | #160 | Good $95,560 |
| Immigrants | Portugal | 62.8 /100 | #161 | Good $95,512 |
| Swiss | 62.8 /100 | #162 | Good $95,511 |
| Immigrants | Saudi Arabia | 62.0 /100 | #163 | Good $95,450 |
| South Americans | 60.9 /100 | #164 | Good $95,362 |
| Immigrants | Nepal | 60.3 /100 | #165 | Good $95,322 |
| Immigrants | Ethiopia | 59.5 /100 | #166 | Average $95,256 |
Demographics Similar to Immigrants from Costa Rica by Householder Income Ages 25 - 44 years
In terms of householder income ages 25 - 44 years, the demographic groups most similar to Immigrants from Costa Rica are Tlingit-Haida ($92,987, a difference of 0.12%), Welsh ($93,039, a difference of 0.18%), Dutch ($93,081, a difference of 0.22%), Immigrants from Sierra Leone ($93,115, a difference of 0.26%), and Spaniard ($93,366, a difference of 0.53%).
| Demographics | Rating | Rank | Householder Income Ages 25 - 44 years |
| Immigrants | Eritrea | 35.2 /100 | #185 | Fair $93,466 |
| Sierra Leoneans | 34.8 /100 | #186 | Fair $93,435 |
| Spaniards | 34.0 /100 | #187 | Fair $93,366 |
| Immigrants | Sierra Leone | 30.9 /100 | #188 | Fair $93,115 |
| Dutch | 30.5 /100 | #189 | Fair $93,081 |
| Welsh | 30.0 /100 | #190 | Fair $93,039 |
| Tlingit-Haida | 29.4 /100 | #191 | Fair $92,987 |
| Immigrants | Costa Rica | 28.2 /100 | #192 | Fair $92,876 |
| Samoans | 23.0 /100 | #193 | Fair $92,385 |
| Immigrants | Azores | 22.4 /100 | #194 | Fair $92,322 |
| Celtics | 21.6 /100 | #195 | Fair $92,241 |
| Immigrants | Colombia | 21.3 /100 | #196 | Fair $92,204 |
| Spanish | 21.2 /100 | #197 | Fair $92,200 |
| Vietnamese | 20.2 /100 | #198 | Fair $92,089 |
| Kenyans | 16.8 /100 | #199 | Poor $91,684 |