Croatian vs Immigrants from Costa Rica Householder Income Ages 25 - 44 years
COMPARE
Croatian
Immigrants from Costa Rica
Householder Income Ages 25 - 44 years
Householder Income Ages 25 - 44 years Comparison
Croatians
Immigrants from Costa Rica
$102,414
HOUSEHOLDER INCOME AGES 25 - 44 YEARS
98.7/ 100
METRIC RATING
91st/ 347
METRIC RANK
$92,876
HOUSEHOLDER INCOME AGES 25 - 44 YEARS
28.2/ 100
METRIC RATING
192nd/ 347
METRIC RANK
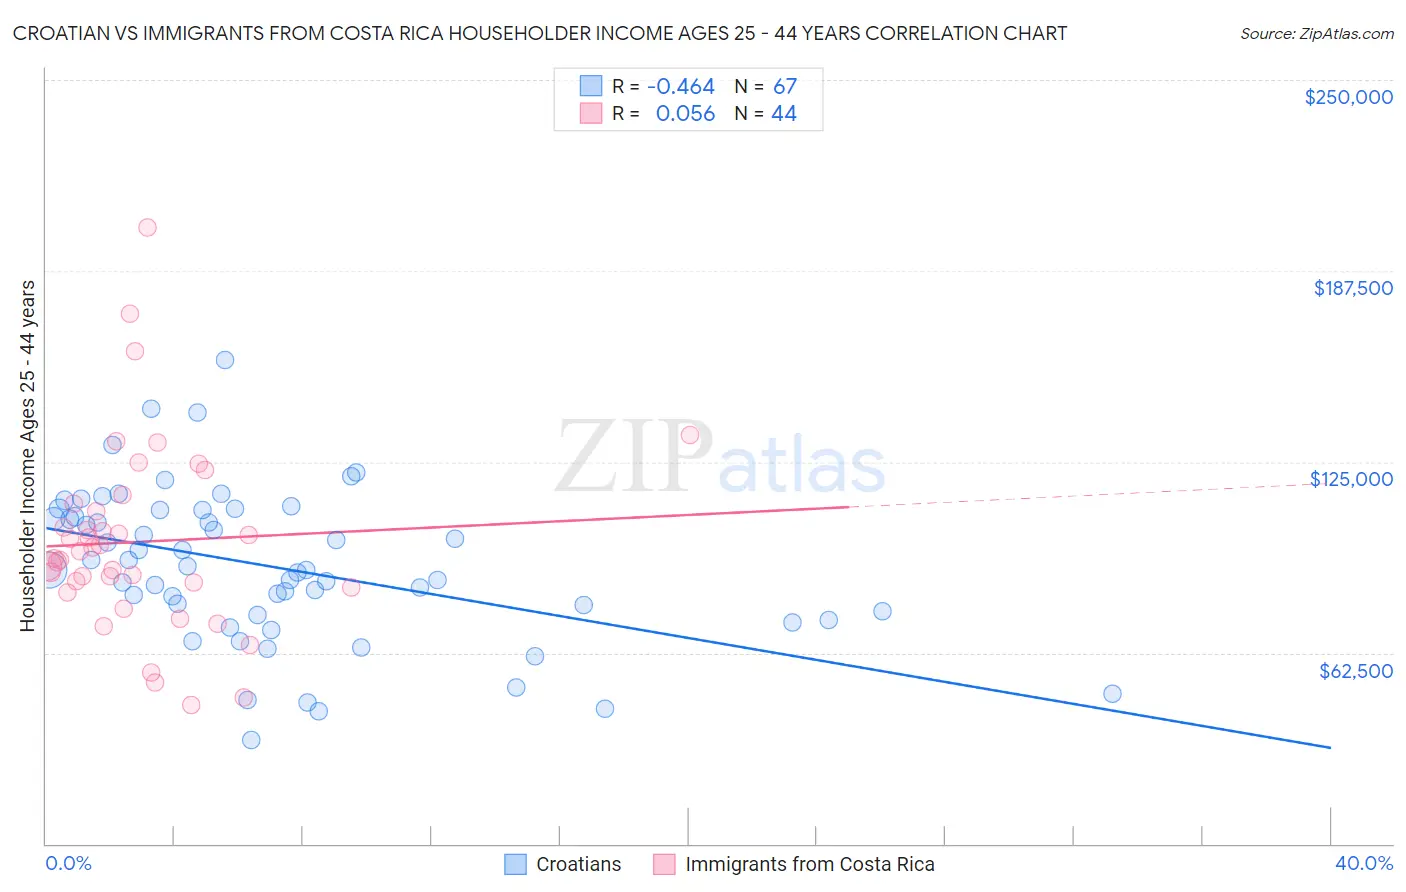
Croatian vs Immigrants from Costa Rica Householder Income Ages 25 - 44 years Correlation Chart
The statistical analysis conducted on geographies consisting of 374,641,532 people shows a moderate negative correlation between the proportion of Croatians and household income with householder between the ages 25 and 44 in the United States with a correlation coefficient (R) of -0.464 and weighted average of $102,414. Similarly, the statistical analysis conducted on geographies consisting of 204,048,993 people shows a slight positive correlation between the proportion of Immigrants from Costa Rica and household income with householder between the ages 25 and 44 in the United States with a correlation coefficient (R) of 0.056 and weighted average of $92,876, a difference of 10.3%.
Householder Income Ages 25 - 44 years Correlation Summary
| Measurement | Croatian | Immigrants from Costa Rica |
| Minimum | $33,958 | $45,556 |
| Maximum | $158,158 | $201,608 |
| Range | $124,200 | $156,052 |
| Mean | $90,676 | $98,859 |
| Median | $89,581 | $94,496 |
| Interquartile 25% (IQ1) | $75,000 | $84,714 |
| Interquartile 75% (IQ3) | $109,113 | $110,006 |
| Interquartile Range (IQR) | $34,113 | $25,292 |
| Standard Deviation (Sample) | $25,045 | $30,715 |
| Standard Deviation (Population) | $24,857 | $30,364 |
Similar Demographics by Householder Income Ages 25 - 44 years
Demographics Similar to Croatians by Householder Income Ages 25 - 44 years
In terms of householder income ages 25 - 44 years, the demographic groups most similar to Croatians are Immigrants from North America ($102,407, a difference of 0.010%), Ukrainian ($102,451, a difference of 0.040%), Romanian ($102,544, a difference of 0.13%), Immigrants from Canada ($102,616, a difference of 0.20%), and Immigrants from Western Europe ($102,654, a difference of 0.23%).
| Demographics | Rating | Rank | Householder Income Ages 25 - 44 years |
| Immigrants | Philippines | 99.0 /100 | #84 | Exceptional $102,910 |
| Immigrants | Ukraine | 98.9 /100 | #85 | Exceptional $102,664 |
| Immigrants | Hungary | 98.9 /100 | #86 | Exceptional $102,655 |
| Immigrants | Western Europe | 98.9 /100 | #87 | Exceptional $102,654 |
| Immigrants | Canada | 98.9 /100 | #88 | Exceptional $102,616 |
| Romanians | 98.8 /100 | #89 | Exceptional $102,544 |
| Ukrainians | 98.8 /100 | #90 | Exceptional $102,451 |
| Croatians | 98.7 /100 | #91 | Exceptional $102,414 |
| Immigrants | North America | 98.7 /100 | #92 | Exceptional $102,407 |
| Immigrants | England | 98.4 /100 | #93 | Exceptional $102,020 |
| Sri Lankans | 98.4 /100 | #94 | Exceptional $101,960 |
| Assyrians/Chaldeans/Syriacs | 98.3 /100 | #95 | Exceptional $101,936 |
| Macedonians | 98.3 /100 | #96 | Exceptional $101,882 |
| Austrians | 98.3 /100 | #97 | Exceptional $101,842 |
| Immigrants | Kazakhstan | 98.1 /100 | #98 | Exceptional $101,727 |
Demographics Similar to Immigrants from Costa Rica by Householder Income Ages 25 - 44 years
In terms of householder income ages 25 - 44 years, the demographic groups most similar to Immigrants from Costa Rica are Tlingit-Haida ($92,987, a difference of 0.12%), Welsh ($93,039, a difference of 0.18%), Dutch ($93,081, a difference of 0.22%), Immigrants from Sierra Leone ($93,115, a difference of 0.26%), and Spaniard ($93,366, a difference of 0.53%).
| Demographics | Rating | Rank | Householder Income Ages 25 - 44 years |
| Immigrants | Eritrea | 35.2 /100 | #185 | Fair $93,466 |
| Sierra Leoneans | 34.8 /100 | #186 | Fair $93,435 |
| Spaniards | 34.0 /100 | #187 | Fair $93,366 |
| Immigrants | Sierra Leone | 30.9 /100 | #188 | Fair $93,115 |
| Dutch | 30.5 /100 | #189 | Fair $93,081 |
| Welsh | 30.0 /100 | #190 | Fair $93,039 |
| Tlingit-Haida | 29.4 /100 | #191 | Fair $92,987 |
| Immigrants | Costa Rica | 28.2 /100 | #192 | Fair $92,876 |
| Samoans | 23.0 /100 | #193 | Fair $92,385 |
| Immigrants | Azores | 22.4 /100 | #194 | Fair $92,322 |
| Celtics | 21.6 /100 | #195 | Fair $92,241 |
| Immigrants | Colombia | 21.3 /100 | #196 | Fair $92,204 |
| Spanish | 21.2 /100 | #197 | Fair $92,200 |
| Vietnamese | 20.2 /100 | #198 | Fair $92,089 |
| Kenyans | 16.8 /100 | #199 | Poor $91,684 |