Immigrants from Africa vs Immigrants from Nigeria Householder Income Ages 25 - 44 years
COMPARE
Immigrants from Africa
Immigrants from Nigeria
Householder Income Ages 25 - 44 years
Householder Income Ages 25 - 44 years Comparison
Immigrants from Africa
Immigrants from Nigeria
$90,372
HOUSEHOLDER INCOME AGES 25 - 44 YEARS
8.9/ 100
METRIC RATING
214th/ 347
METRIC RANK
$86,589
HOUSEHOLDER INCOME AGES 25 - 44 YEARS
1.2/ 100
METRIC RATING
247th/ 347
METRIC RANK
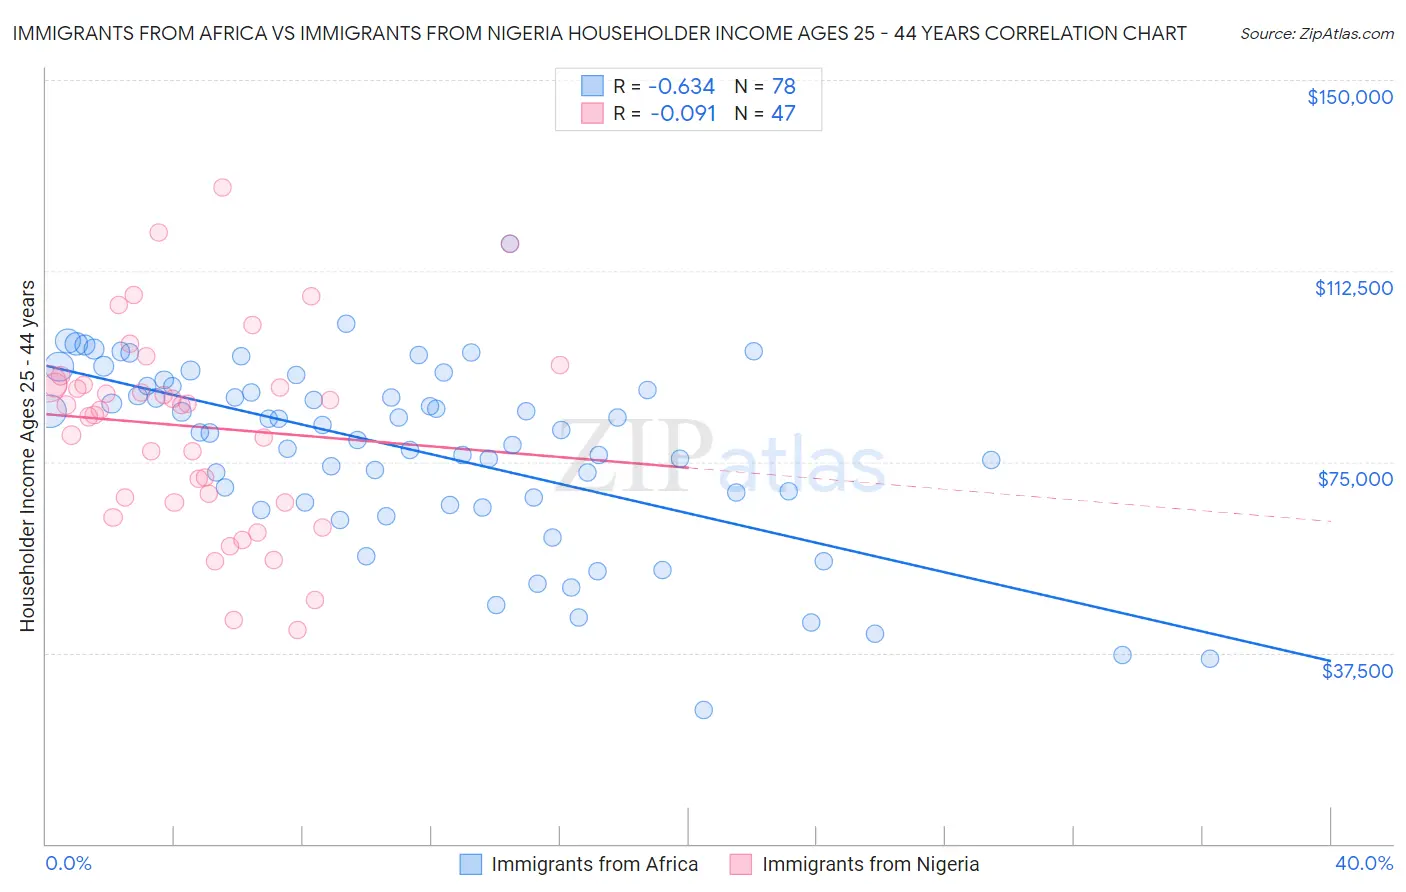
Immigrants from Africa vs Immigrants from Nigeria Householder Income Ages 25 - 44 years Correlation Chart
The statistical analysis conducted on geographies consisting of 467,630,423 people shows a significant negative correlation between the proportion of Immigrants from Africa and household income with householder between the ages 25 and 44 in the United States with a correlation coefficient (R) of -0.634 and weighted average of $90,372. Similarly, the statistical analysis conducted on geographies consisting of 283,094,597 people shows a slight negative correlation between the proportion of Immigrants from Nigeria and household income with householder between the ages 25 and 44 in the United States with a correlation coefficient (R) of -0.091 and weighted average of $86,589, a difference of 4.4%.
Householder Income Ages 25 - 44 years Correlation Summary
| Measurement | Immigrants from Africa | Immigrants from Nigeria |
| Minimum | $26,250 | $42,092 |
| Maximum | $117,804 | $128,882 |
| Range | $91,554 | $86,790 |
| Mean | $77,244 | $81,924 |
| Median | $81,060 | $86,086 |
| Interquartile 25% (IQ1) | $67,103 | $67,086 |
| Interquartile 75% (IQ3) | $89,908 | $90,392 |
| Interquartile Range (IQR) | $22,805 | $23,305 |
| Standard Deviation (Sample) | $17,876 | $19,417 |
| Standard Deviation (Population) | $17,761 | $19,209 |
Similar Demographics by Householder Income Ages 25 - 44 years
Demographics Similar to Immigrants from Africa by Householder Income Ages 25 - 44 years
In terms of householder income ages 25 - 44 years, the demographic groups most similar to Immigrants from Africa are Immigrants from Bangladesh ($90,448, a difference of 0.090%), Panamanian ($90,193, a difference of 0.20%), Ghanaian ($90,137, a difference of 0.26%), Hawaiian ($90,722, a difference of 0.39%), and Iraqi ($90,764, a difference of 0.43%).
| Demographics | Rating | Rank | Householder Income Ages 25 - 44 years |
| Yugoslavians | 14.5 /100 | #207 | Poor $91,368 |
| Immigrants | Thailand | 14.3 /100 | #208 | Poor $91,337 |
| Immigrants | Uruguay | 13.2 /100 | #209 | Poor $91,171 |
| Immigrants | Kenya | 10.9 /100 | #210 | Poor $90,767 |
| Iraqis | 10.8 /100 | #211 | Poor $90,764 |
| Hawaiians | 10.6 /100 | #212 | Poor $90,722 |
| Immigrants | Bangladesh | 9.3 /100 | #213 | Tragic $90,448 |
| Immigrants | Africa | 8.9 /100 | #214 | Tragic $90,372 |
| Panamanians | 8.1 /100 | #215 | Tragic $90,193 |
| Ghanaians | 7.9 /100 | #216 | Tragic $90,137 |
| Scotch-Irish | 7.3 /100 | #217 | Tragic $89,969 |
| Guyanese | 7.1 /100 | #218 | Tragic $89,940 |
| Delaware | 6.9 /100 | #219 | Tragic $89,876 |
| Trinidadians and Tobagonians | 6.8 /100 | #220 | Tragic $89,856 |
| Immigrants | Trinidad and Tobago | 6.5 /100 | #221 | Tragic $89,748 |
Demographics Similar to Immigrants from Nigeria by Householder Income Ages 25 - 44 years
In terms of householder income ages 25 - 44 years, the demographic groups most similar to Immigrants from Nigeria are Immigrants from Burma/Myanmar ($86,736, a difference of 0.17%), Immigrants from El Salvador ($86,913, a difference of 0.37%), Immigrants from Venezuela ($87,038, a difference of 0.52%), Immigrants from West Indies ($87,063, a difference of 0.55%), and Immigrants from Sudan ($86,109, a difference of 0.56%).
| Demographics | Rating | Rank | Householder Income Ages 25 - 44 years |
| Nicaraguans | 2.2 /100 | #240 | Tragic $87,751 |
| Nigerians | 2.2 /100 | #241 | Tragic $87,730 |
| West Indians | 1.7 /100 | #242 | Tragic $87,205 |
| Immigrants | West Indies | 1.5 /100 | #243 | Tragic $87,063 |
| Immigrants | Venezuela | 1.5 /100 | #244 | Tragic $87,038 |
| Immigrants | El Salvador | 1.4 /100 | #245 | Tragic $86,913 |
| Immigrants | Burma/Myanmar | 1.3 /100 | #246 | Tragic $86,736 |
| Immigrants | Nigeria | 1.2 /100 | #247 | Tragic $86,589 |
| Immigrants | Sudan | 0.9 /100 | #248 | Tragic $86,109 |
| French American Indians | 0.8 /100 | #249 | Tragic $85,899 |
| Pennsylvania Germans | 0.8 /100 | #250 | Tragic $85,836 |
| Cape Verdeans | 0.8 /100 | #251 | Tragic $85,758 |
| Immigrants | Western Africa | 0.7 /100 | #252 | Tragic $85,676 |
| British West Indians | 0.7 /100 | #253 | Tragic $85,565 |
| Immigrants | Laos | 0.7 /100 | #254 | Tragic $85,553 |