Immigrants from Africa vs Seminole Householder Income Ages 25 - 44 years
COMPARE
Immigrants from Africa
Seminole
Householder Income Ages 25 - 44 years
Householder Income Ages 25 - 44 years Comparison
Immigrants from Africa
Seminole
$90,372
HOUSEHOLDER INCOME AGES 25 - 44 YEARS
8.9/ 100
METRIC RATING
214th/ 347
METRIC RANK
$76,584
HOUSEHOLDER INCOME AGES 25 - 44 YEARS
0.0/ 100
METRIC RATING
329th/ 347
METRIC RANK
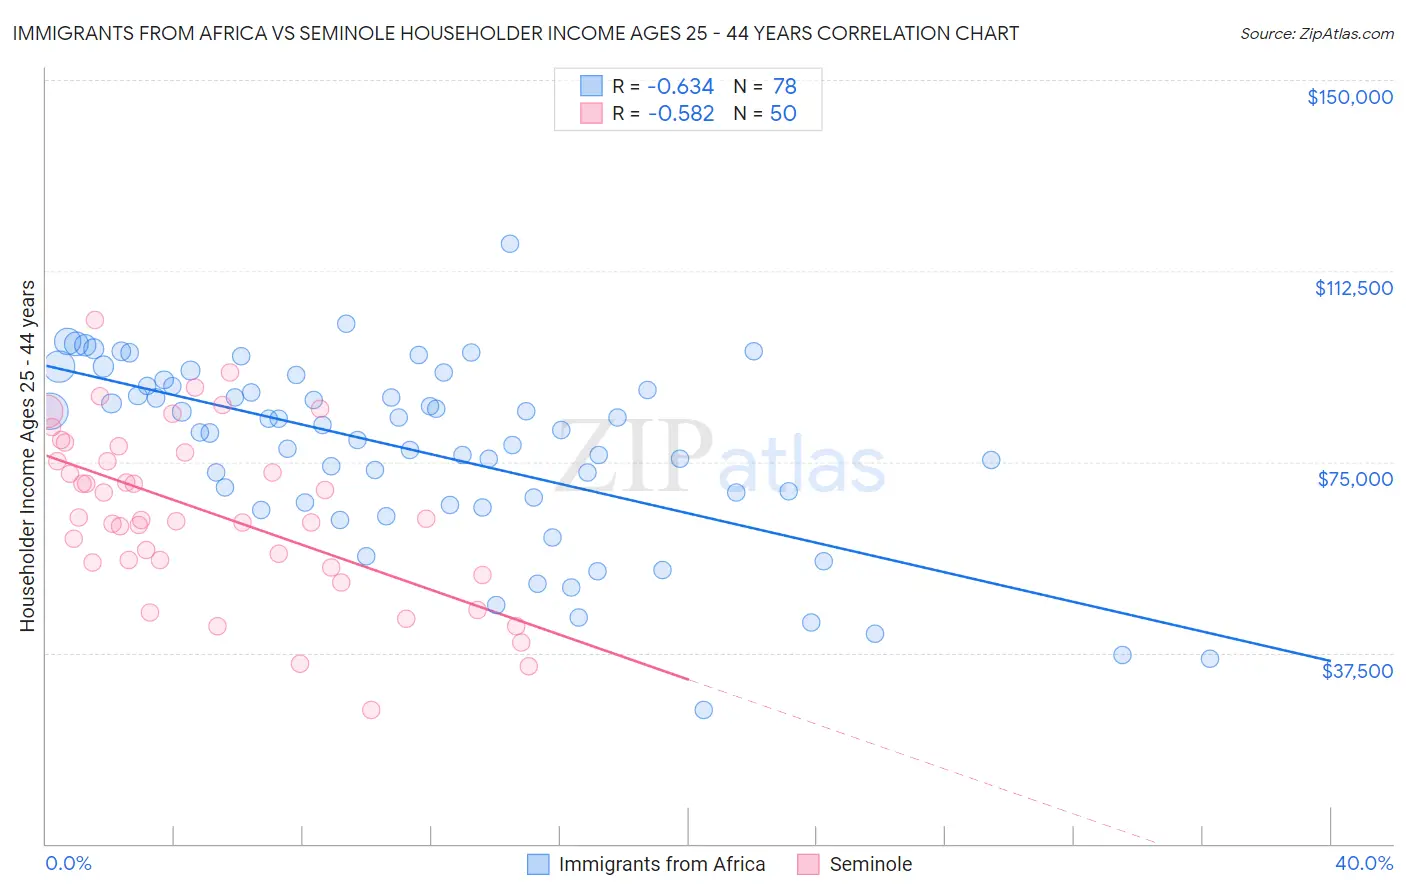
Immigrants from Africa vs Seminole Householder Income Ages 25 - 44 years Correlation Chart
The statistical analysis conducted on geographies consisting of 467,630,423 people shows a significant negative correlation between the proportion of Immigrants from Africa and household income with householder between the ages 25 and 44 in the United States with a correlation coefficient (R) of -0.634 and weighted average of $90,372. Similarly, the statistical analysis conducted on geographies consisting of 118,219,857 people shows a substantial negative correlation between the proportion of Seminole and household income with householder between the ages 25 and 44 in the United States with a correlation coefficient (R) of -0.582 and weighted average of $76,584, a difference of 18.0%.
Householder Income Ages 25 - 44 years Correlation Summary
| Measurement | Immigrants from Africa | Seminole |
| Minimum | $26,250 | $26,250 |
| Maximum | $117,804 | $102,754 |
| Range | $91,554 | $76,504 |
| Mean | $77,244 | $65,024 |
| Median | $81,060 | $63,631 |
| Interquartile 25% (IQ1) | $67,103 | $55,292 |
| Interquartile 75% (IQ3) | $89,908 | $76,875 |
| Interquartile Range (IQR) | $22,805 | $21,583 |
| Standard Deviation (Sample) | $17,876 | $16,561 |
| Standard Deviation (Population) | $17,761 | $16,395 |
Similar Demographics by Householder Income Ages 25 - 44 years
Demographics Similar to Immigrants from Africa by Householder Income Ages 25 - 44 years
In terms of householder income ages 25 - 44 years, the demographic groups most similar to Immigrants from Africa are Immigrants from Bangladesh ($90,448, a difference of 0.090%), Panamanian ($90,193, a difference of 0.20%), Ghanaian ($90,137, a difference of 0.26%), Hawaiian ($90,722, a difference of 0.39%), and Iraqi ($90,764, a difference of 0.43%).
| Demographics | Rating | Rank | Householder Income Ages 25 - 44 years |
| Yugoslavians | 14.5 /100 | #207 | Poor $91,368 |
| Immigrants | Thailand | 14.3 /100 | #208 | Poor $91,337 |
| Immigrants | Uruguay | 13.2 /100 | #209 | Poor $91,171 |
| Immigrants | Kenya | 10.9 /100 | #210 | Poor $90,767 |
| Iraqis | 10.8 /100 | #211 | Poor $90,764 |
| Hawaiians | 10.6 /100 | #212 | Poor $90,722 |
| Immigrants | Bangladesh | 9.3 /100 | #213 | Tragic $90,448 |
| Immigrants | Africa | 8.9 /100 | #214 | Tragic $90,372 |
| Panamanians | 8.1 /100 | #215 | Tragic $90,193 |
| Ghanaians | 7.9 /100 | #216 | Tragic $90,137 |
| Scotch-Irish | 7.3 /100 | #217 | Tragic $89,969 |
| Guyanese | 7.1 /100 | #218 | Tragic $89,940 |
| Delaware | 6.9 /100 | #219 | Tragic $89,876 |
| Trinidadians and Tobagonians | 6.8 /100 | #220 | Tragic $89,856 |
| Immigrants | Trinidad and Tobago | 6.5 /100 | #221 | Tragic $89,748 |
Demographics Similar to Seminole by Householder Income Ages 25 - 44 years
In terms of householder income ages 25 - 44 years, the demographic groups most similar to Seminole are Immigrants from Cuba ($76,701, a difference of 0.15%), Immigrants from Bahamas ($76,910, a difference of 0.42%), Yakama ($76,226, a difference of 0.47%), Houma ($77,044, a difference of 0.60%), and Sioux ($77,089, a difference of 0.66%).
| Demographics | Rating | Rank | Householder Income Ages 25 - 44 years |
| Chickasaw | 0.0 /100 | #322 | Tragic $77,929 |
| Immigrants | Honduras | 0.0 /100 | #323 | Tragic $77,328 |
| Dutch West Indians | 0.0 /100 | #324 | Tragic $77,260 |
| Sioux | 0.0 /100 | #325 | Tragic $77,089 |
| Houma | 0.0 /100 | #326 | Tragic $77,044 |
| Immigrants | Bahamas | 0.0 /100 | #327 | Tragic $76,910 |
| Immigrants | Cuba | 0.0 /100 | #328 | Tragic $76,701 |
| Seminole | 0.0 /100 | #329 | Tragic $76,584 |
| Yakama | 0.0 /100 | #330 | Tragic $76,226 |
| Natives/Alaskans | 0.0 /100 | #331 | Tragic $75,647 |
| Bahamians | 0.0 /100 | #332 | Tragic $75,395 |
| Hopi | 0.0 /100 | #333 | Tragic $75,002 |
| Creek | 0.0 /100 | #334 | Tragic $74,847 |
| Kiowa | 0.0 /100 | #335 | Tragic $74,776 |
| Yup'ik | 0.0 /100 | #336 | Tragic $73,688 |