Iraqi vs Immigrants from Costa Rica Householder Income Ages 25 - 44 years
COMPARE
Iraqi
Immigrants from Costa Rica
Householder Income Ages 25 - 44 years
Householder Income Ages 25 - 44 years Comparison
Iraqis
Immigrants from Costa Rica
$90,764
HOUSEHOLDER INCOME AGES 25 - 44 YEARS
10.8/ 100
METRIC RATING
211th/ 347
METRIC RANK
$92,876
HOUSEHOLDER INCOME AGES 25 - 44 YEARS
28.2/ 100
METRIC RATING
192nd/ 347
METRIC RANK
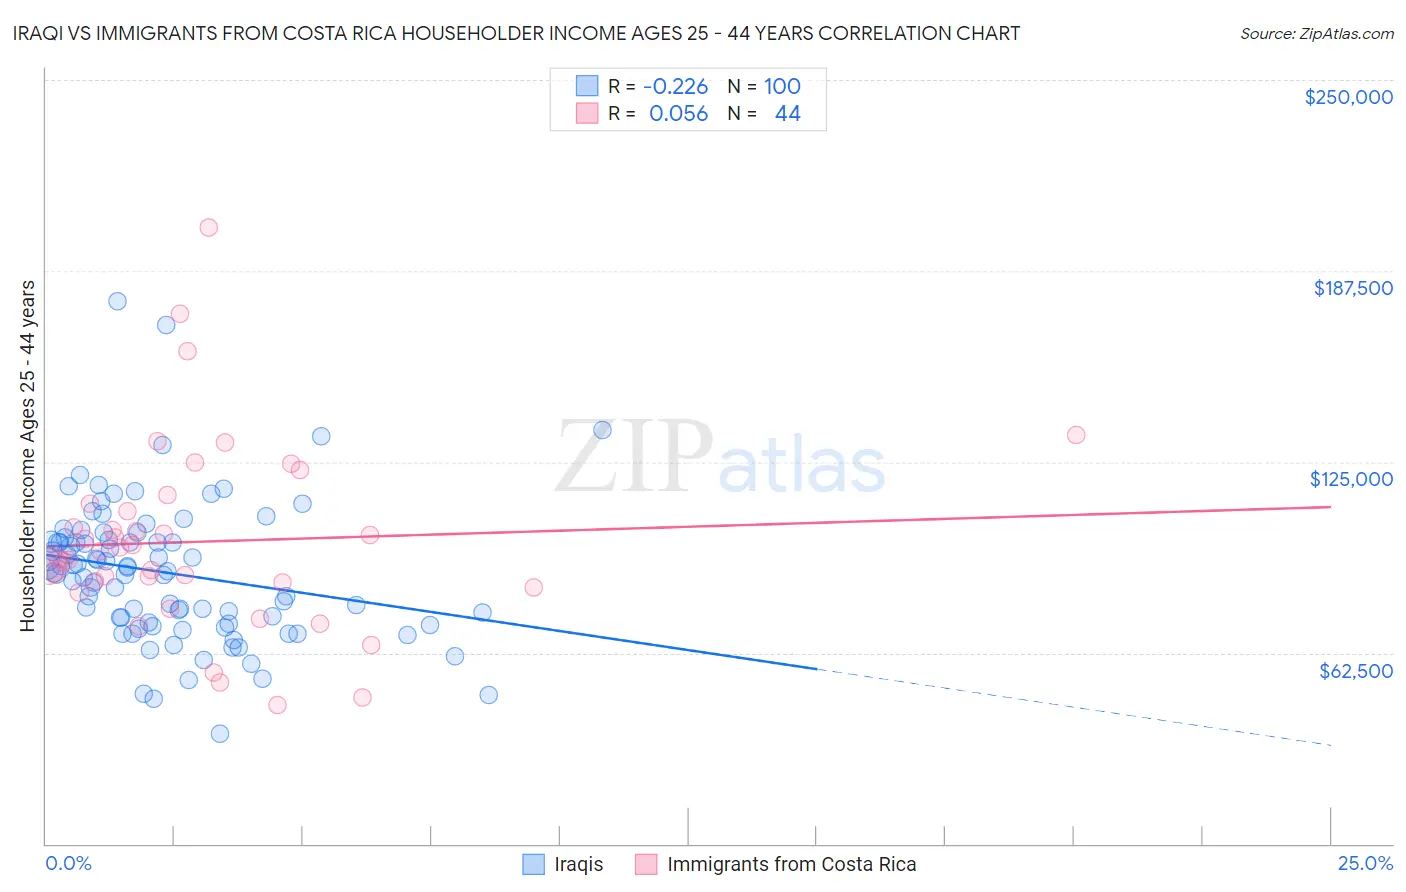
Iraqi vs Immigrants from Costa Rica Householder Income Ages 25 - 44 years Correlation Chart
The statistical analysis conducted on geographies consisting of 170,561,402 people shows a weak negative correlation between the proportion of Iraqis and household income with householder between the ages 25 and 44 in the United States with a correlation coefficient (R) of -0.226 and weighted average of $90,764. Similarly, the statistical analysis conducted on geographies consisting of 204,048,993 people shows a slight positive correlation between the proportion of Immigrants from Costa Rica and household income with householder between the ages 25 and 44 in the United States with a correlation coefficient (R) of 0.056 and weighted average of $92,876, a difference of 2.3%.
Householder Income Ages 25 - 44 years Correlation Summary
| Measurement | Iraqi | Immigrants from Costa Rica |
| Minimum | $35,938 | $45,556 |
| Maximum | $177,567 | $201,608 |
| Range | $141,629 | $156,052 |
| Mean | $88,687 | $98,859 |
| Median | $88,906 | $94,496 |
| Interquartile 25% (IQ1) | $72,138 | $84,714 |
| Interquartile 75% (IQ3) | $99,186 | $110,006 |
| Interquartile Range (IQR) | $27,048 | $25,292 |
| Standard Deviation (Sample) | $23,025 | $30,715 |
| Standard Deviation (Population) | $22,910 | $30,364 |
Demographics Similar to Iraqis and Immigrants from Costa Rica by Householder Income Ages 25 - 44 years
In terms of householder income ages 25 - 44 years, the demographic groups most similar to Iraqis are Immigrants from Kenya ($90,767, a difference of 0.0%), Immigrants from Uruguay ($91,171, a difference of 0.45%), Immigrants from Thailand ($91,337, a difference of 0.63%), Aleut ($91,370, a difference of 0.67%), and Yugoslavian ($91,368, a difference of 0.67%). Similarly, the demographic groups most similar to Immigrants from Costa Rica are Tlingit-Haida ($92,987, a difference of 0.12%), Samoan ($92,385, a difference of 0.53%), Immigrants from the Azores ($92,322, a difference of 0.60%), Celtic ($92,241, a difference of 0.69%), and Immigrants from Colombia ($92,204, a difference of 0.73%).
| Demographics | Rating | Rank | Householder Income Ages 25 - 44 years |
| Tlingit-Haida | 29.4 /100 | #191 | Fair $92,987 |
| Immigrants | Costa Rica | 28.2 /100 | #192 | Fair $92,876 |
| Samoans | 23.0 /100 | #193 | Fair $92,385 |
| Immigrants | Azores | 22.4 /100 | #194 | Fair $92,322 |
| Celtics | 21.6 /100 | #195 | Fair $92,241 |
| Immigrants | Colombia | 21.3 /100 | #196 | Fair $92,204 |
| Spanish | 21.2 /100 | #197 | Fair $92,200 |
| Vietnamese | 20.2 /100 | #198 | Fair $92,089 |
| Kenyans | 16.8 /100 | #199 | Poor $91,684 |
| Whites/Caucasians | 16.7 /100 | #200 | Poor $91,668 |
| Japanese | 16.4 /100 | #201 | Poor $91,624 |
| Ecuadorians | 16.0 /100 | #202 | Poor $91,574 |
| Immigrants | Cambodia | 15.7 /100 | #203 | Poor $91,533 |
| Nepalese | 15.4 /100 | #204 | Poor $91,498 |
| Immigrants | Eastern Africa | 15.2 /100 | #205 | Poor $91,458 |
| Aleuts | 14.5 /100 | #206 | Poor $91,370 |
| Yugoslavians | 14.5 /100 | #207 | Poor $91,368 |
| Immigrants | Thailand | 14.3 /100 | #208 | Poor $91,337 |
| Immigrants | Uruguay | 13.2 /100 | #209 | Poor $91,171 |
| Immigrants | Kenya | 10.9 /100 | #210 | Poor $90,767 |
| Iraqis | 10.8 /100 | #211 | Poor $90,764 |