Immigrants from Middle Africa vs Immigrants from Costa Rica Householder Income Ages 25 - 44 years
COMPARE
Immigrants from Middle Africa
Immigrants from Costa Rica
Householder Income Ages 25 - 44 years
Householder Income Ages 25 - 44 years Comparison
Immigrants from Middle Africa
Immigrants from Costa Rica
$82,254
HOUSEHOLDER INCOME AGES 25 - 44 YEARS
0.1/ 100
METRIC RATING
284th/ 347
METRIC RANK
$92,876
HOUSEHOLDER INCOME AGES 25 - 44 YEARS
28.2/ 100
METRIC RATING
192nd/ 347
METRIC RANK
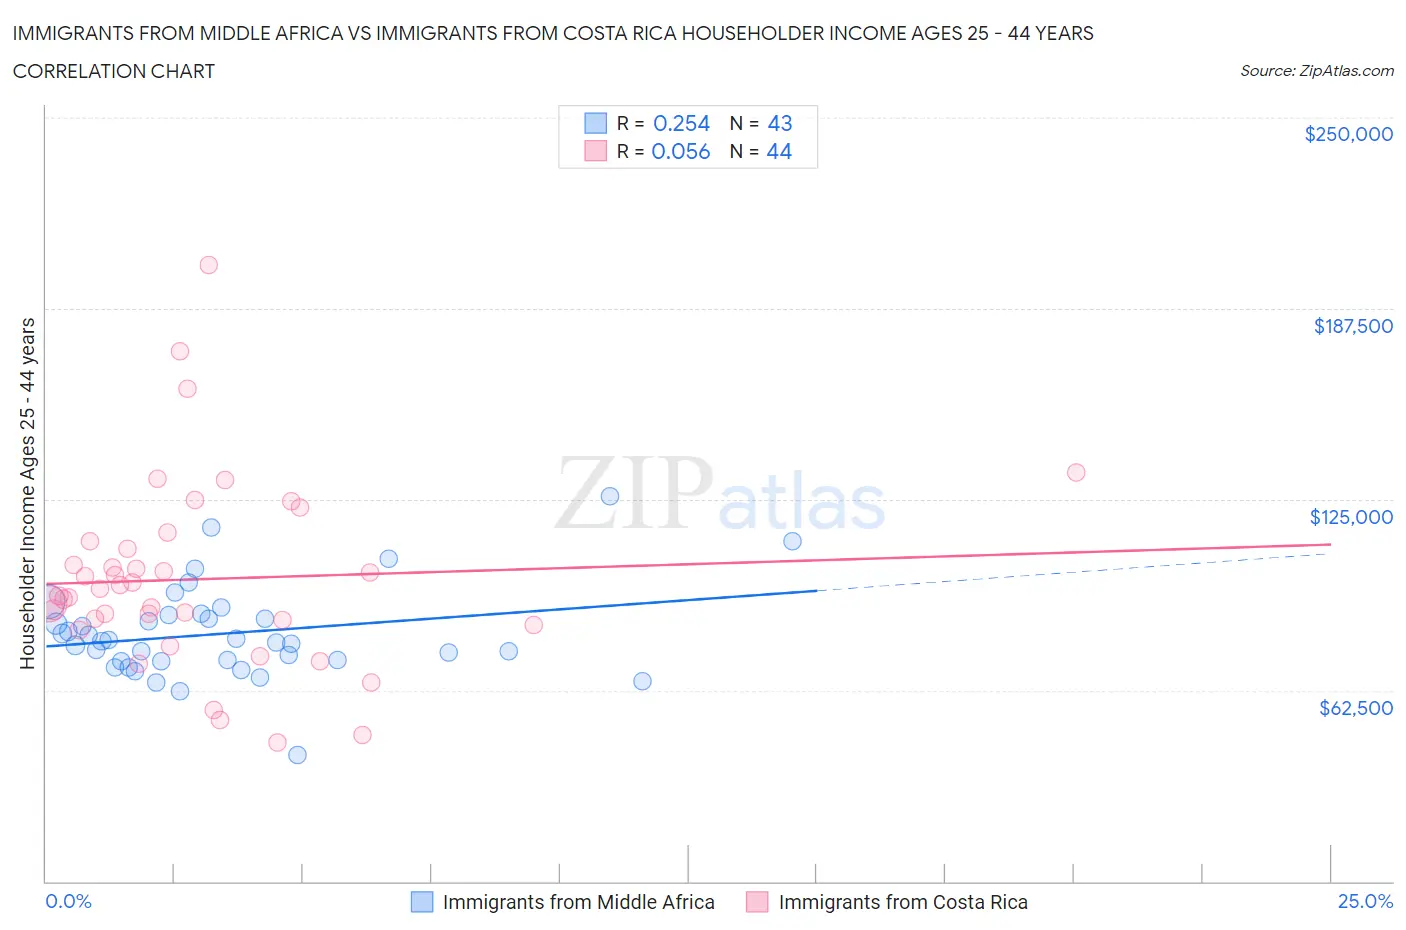
Immigrants from Middle Africa vs Immigrants from Costa Rica Householder Income Ages 25 - 44 years Correlation Chart
The statistical analysis conducted on geographies consisting of 202,520,719 people shows a weak positive correlation between the proportion of Immigrants from Middle Africa and household income with householder between the ages 25 and 44 in the United States with a correlation coefficient (R) of 0.254 and weighted average of $82,254. Similarly, the statistical analysis conducted on geographies consisting of 204,048,993 people shows a slight positive correlation between the proportion of Immigrants from Costa Rica and household income with householder between the ages 25 and 44 in the United States with a correlation coefficient (R) of 0.056 and weighted average of $92,876, a difference of 12.9%.
Householder Income Ages 25 - 44 years Correlation Summary
| Measurement | Immigrants from Middle Africa | Immigrants from Costa Rica |
| Minimum | $41,159 | $45,556 |
| Maximum | $125,889 | $201,608 |
| Range | $84,730 | $156,052 |
| Mean | $81,156 | $98,859 |
| Median | $78,481 | $94,496 |
| Interquartile 25% (IQ1) | $72,155 | $84,714 |
| Interquartile 75% (IQ3) | $87,087 | $110,006 |
| Interquartile Range (IQR) | $14,931 | $25,292 |
| Standard Deviation (Sample) | $15,197 | $30,715 |
| Standard Deviation (Population) | $15,019 | $30,364 |
Similar Demographics by Householder Income Ages 25 - 44 years
Demographics Similar to Immigrants from Middle Africa by Householder Income Ages 25 - 44 years
In terms of householder income ages 25 - 44 years, the demographic groups most similar to Immigrants from Middle Africa are Immigrants from Somalia ($82,188, a difference of 0.080%), Guatemalan ($82,331, a difference of 0.090%), Ute ($82,166, a difference of 0.11%), Immigrants from Latin America ($82,166, a difference of 0.11%), and Central American Indian ($82,355, a difference of 0.12%).
| Demographics | Rating | Rank | Householder Income Ages 25 - 44 years |
| Paiute | 0.2 /100 | #277 | Tragic $82,984 |
| Senegalese | 0.2 /100 | #278 | Tragic $82,852 |
| Pima | 0.1 /100 | #279 | Tragic $82,821 |
| Colville | 0.1 /100 | #280 | Tragic $82,604 |
| Cajuns | 0.1 /100 | #281 | Tragic $82,393 |
| Central American Indians | 0.1 /100 | #282 | Tragic $82,355 |
| Guatemalans | 0.1 /100 | #283 | Tragic $82,331 |
| Immigrants | Middle Africa | 0.1 /100 | #284 | Tragic $82,254 |
| Immigrants | Somalia | 0.1 /100 | #285 | Tragic $82,188 |
| Ute | 0.1 /100 | #286 | Tragic $82,166 |
| Immigrants | Latin America | 0.1 /100 | #287 | Tragic $82,166 |
| Comanche | 0.1 /100 | #288 | Tragic $82,152 |
| Shoshone | 0.1 /100 | #289 | Tragic $82,062 |
| Liberians | 0.1 /100 | #290 | Tragic $82,005 |
| Potawatomi | 0.1 /100 | #291 | Tragic $81,774 |
Demographics Similar to Immigrants from Costa Rica by Householder Income Ages 25 - 44 years
In terms of householder income ages 25 - 44 years, the demographic groups most similar to Immigrants from Costa Rica are Tlingit-Haida ($92,987, a difference of 0.12%), Welsh ($93,039, a difference of 0.18%), Dutch ($93,081, a difference of 0.22%), Immigrants from Sierra Leone ($93,115, a difference of 0.26%), and Spaniard ($93,366, a difference of 0.53%).
| Demographics | Rating | Rank | Householder Income Ages 25 - 44 years |
| Immigrants | Eritrea | 35.2 /100 | #185 | Fair $93,466 |
| Sierra Leoneans | 34.8 /100 | #186 | Fair $93,435 |
| Spaniards | 34.0 /100 | #187 | Fair $93,366 |
| Immigrants | Sierra Leone | 30.9 /100 | #188 | Fair $93,115 |
| Dutch | 30.5 /100 | #189 | Fair $93,081 |
| Welsh | 30.0 /100 | #190 | Fair $93,039 |
| Tlingit-Haida | 29.4 /100 | #191 | Fair $92,987 |
| Immigrants | Costa Rica | 28.2 /100 | #192 | Fair $92,876 |
| Samoans | 23.0 /100 | #193 | Fair $92,385 |
| Immigrants | Azores | 22.4 /100 | #194 | Fair $92,322 |
| Celtics | 21.6 /100 | #195 | Fair $92,241 |
| Immigrants | Colombia | 21.3 /100 | #196 | Fair $92,204 |
| Spanish | 21.2 /100 | #197 | Fair $92,200 |
| Vietnamese | 20.2 /100 | #198 | Fair $92,089 |
| Kenyans | 16.8 /100 | #199 | Poor $91,684 |