Icelander vs Chinese Median Male Earnings
COMPARE
Icelander
Chinese
Median Male Earnings
Median Male Earnings Comparison
Icelanders
Chinese
$55,415
MEDIAN MALE EARNINGS
71.2/ 100
METRIC RATING
157th/ 347
METRIC RANK
$56,872
MEDIAN MALE EARNINGS
91.1/ 100
METRIC RATING
126th/ 347
METRIC RANK
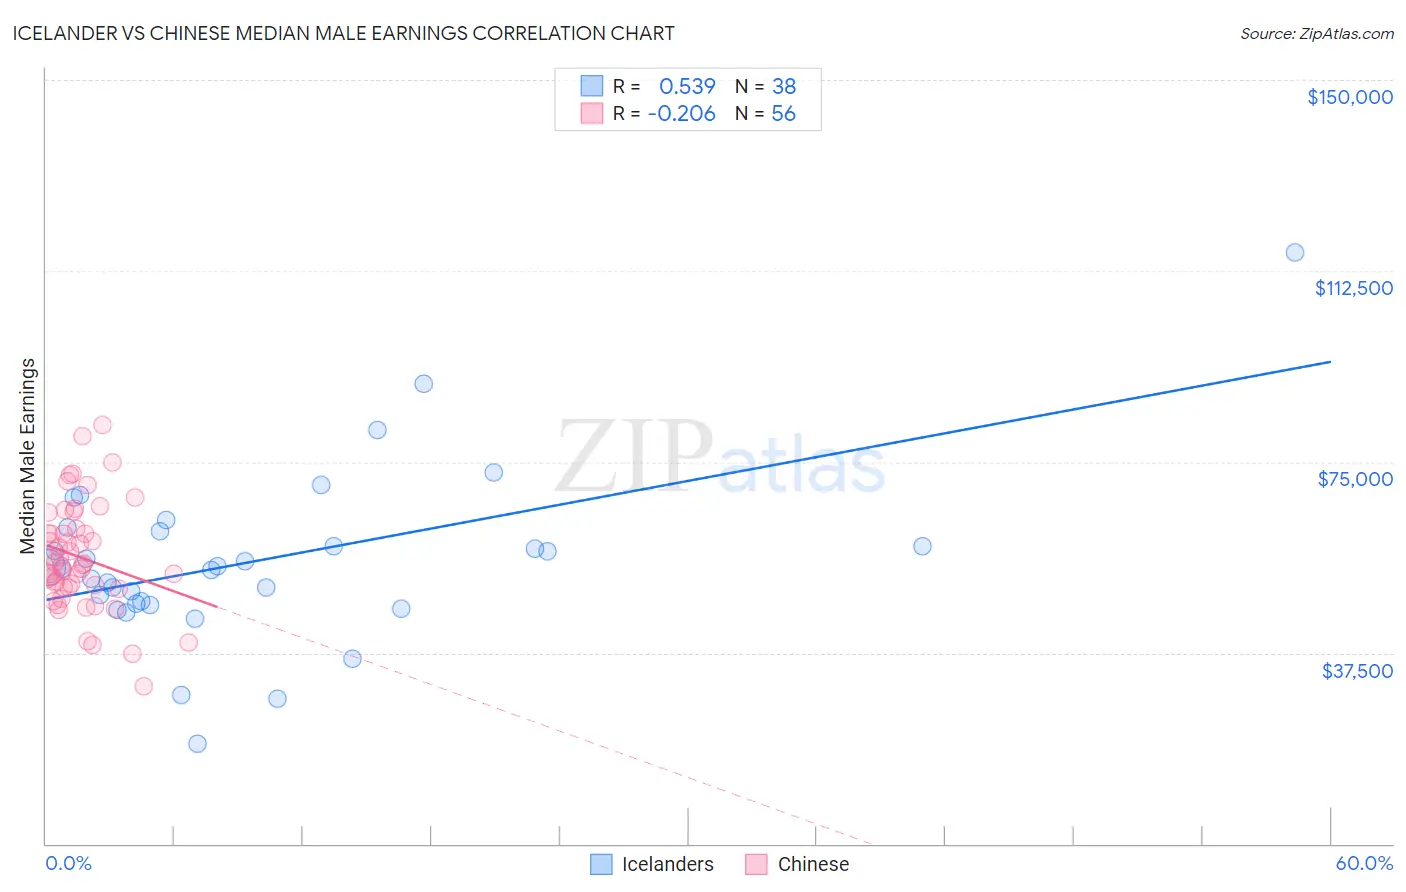
Icelander vs Chinese Median Male Earnings Correlation Chart
The statistical analysis conducted on geographies consisting of 159,653,287 people shows a substantial positive correlation between the proportion of Icelanders and median male earnings in the United States with a correlation coefficient (R) of 0.539 and weighted average of $55,415. Similarly, the statistical analysis conducted on geographies consisting of 64,807,348 people shows a weak negative correlation between the proportion of Chinese and median male earnings in the United States with a correlation coefficient (R) of -0.206 and weighted average of $56,872, a difference of 2.6%.
Median Male Earnings Correlation Summary
| Measurement | Icelander | Chinese |
| Minimum | $19,583 | $31,000 |
| Maximum | $116,188 | $82,197 |
| Range | $96,605 | $51,197 |
| Mean | $55,596 | $56,277 |
| Median | $54,221 | $54,905 |
| Interquartile 25% (IQ1) | $47,034 | $50,221 |
| Interquartile 75% (IQ3) | $61,435 | $61,384 |
| Interquartile Range (IQR) | $14,401 | $11,163 |
| Standard Deviation (Sample) | $16,814 | $10,489 |
| Standard Deviation (Population) | $16,591 | $10,395 |
Similar Demographics by Median Male Earnings
Demographics Similar to Icelanders by Median Male Earnings
In terms of median male earnings, the demographic groups most similar to Icelanders are Immigrants from Ethiopia ($55,434, a difference of 0.030%), Czechoslovakian ($55,382, a difference of 0.060%), Alsatian ($55,380, a difference of 0.060%), Basque ($55,370, a difference of 0.080%), and Belgian ($55,361, a difference of 0.10%).
| Demographics | Rating | Rank | Median Male Earnings |
| Swiss | 77.1 /100 | #150 | Good $55,731 |
| Immigrants | Oceania | 76.8 /100 | #151 | Good $55,712 |
| Peruvians | 75.8 /100 | #152 | Good $55,659 |
| Immigrants | Nepal | 75.0 /100 | #153 | Good $55,615 |
| Taiwanese | 73.9 /100 | #154 | Good $55,556 |
| Scandinavians | 73.4 /100 | #155 | Good $55,527 |
| Immigrants | Ethiopia | 71.6 /100 | #156 | Good $55,434 |
| Icelanders | 71.2 /100 | #157 | Good $55,415 |
| Czechoslovakians | 70.5 /100 | #158 | Good $55,382 |
| Alsatians | 70.5 /100 | #159 | Good $55,380 |
| Basques | 70.3 /100 | #160 | Good $55,370 |
| Belgians | 70.1 /100 | #161 | Good $55,361 |
| French | 69.9 /100 | #162 | Good $55,350 |
| Ugandans | 68.6 /100 | #163 | Good $55,290 |
| Immigrants | South Eastern Asia | 67.6 /100 | #164 | Good $55,241 |
Demographics Similar to Chinese by Median Male Earnings
In terms of median male earnings, the demographic groups most similar to Chinese are Brazilian ($56,837, a difference of 0.060%), Immigrants from Syria ($56,830, a difference of 0.070%), Immigrants from Morocco ($56,958, a difference of 0.15%), Chilean ($56,973, a difference of 0.18%), and Pakistani ($56,719, a difference of 0.27%).
| Demographics | Rating | Rank | Median Male Earnings |
| Arabs | 94.0 /100 | #119 | Exceptional $57,298 |
| Canadians | 93.9 /100 | #120 | Exceptional $57,286 |
| Immigrants | Albania | 93.3 /100 | #121 | Exceptional $57,179 |
| Immigrants | Jordan | 93.1 /100 | #122 | Exceptional $57,145 |
| Slovenes | 93.1 /100 | #123 | Exceptional $57,145 |
| Chileans | 91.9 /100 | #124 | Exceptional $56,973 |
| Immigrants | Morocco | 91.8 /100 | #125 | Exceptional $56,958 |
| Chinese | 91.1 /100 | #126 | Exceptional $56,872 |
| Brazilians | 90.9 /100 | #127 | Exceptional $56,837 |
| Immigrants | Syria | 90.8 /100 | #128 | Exceptional $56,830 |
| Pakistanis | 89.9 /100 | #129 | Excellent $56,719 |
| Koreans | 89.4 /100 | #130 | Excellent $56,672 |
| Portuguese | 89.4 /100 | #131 | Excellent $56,663 |
| Czechs | 88.2 /100 | #132 | Excellent $56,546 |
| Immigrants | Germany | 88.2 /100 | #133 | Excellent $56,542 |