Nigerian vs Ethiopian Householder Income Ages 25 - 44 years
COMPARE
Nigerian
Ethiopian
Householder Income Ages 25 - 44 years
Householder Income Ages 25 - 44 years Comparison
Nigerians
Ethiopians
$87,730
HOUSEHOLDER INCOME AGES 25 - 44 YEARS
2.2/ 100
METRIC RATING
241st/ 347
METRIC RANK
$96,824
HOUSEHOLDER INCOME AGES 25 - 44 YEARS
77.8/ 100
METRIC RATING
146th/ 347
METRIC RANK
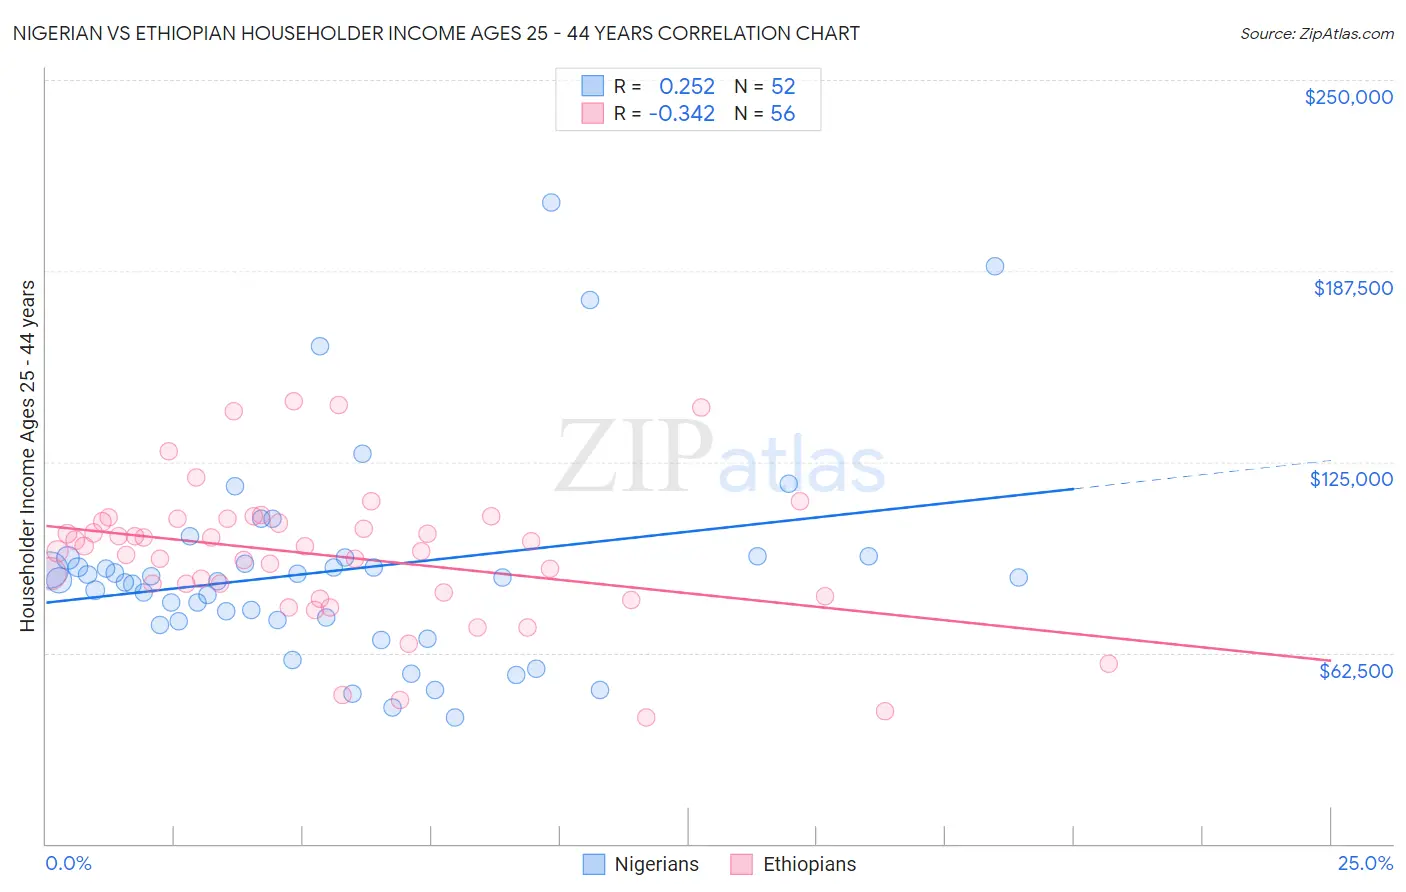
Nigerian vs Ethiopian Householder Income Ages 25 - 44 years Correlation Chart
The statistical analysis conducted on geographies consisting of 332,006,282 people shows a weak positive correlation between the proportion of Nigerians and household income with householder between the ages 25 and 44 in the United States with a correlation coefficient (R) of 0.252 and weighted average of $87,730. Similarly, the statistical analysis conducted on geographies consisting of 222,918,635 people shows a mild negative correlation between the proportion of Ethiopians and household income with householder between the ages 25 and 44 in the United States with a correlation coefficient (R) of -0.342 and weighted average of $96,824, a difference of 10.4%.
Householder Income Ages 25 - 44 years Correlation Summary
| Measurement | Nigerian | Ethiopian |
| Minimum | $41,500 | $41,159 |
| Maximum | $210,089 | $144,957 |
| Range | $168,589 | $103,798 |
| Mean | $89,439 | $94,277 |
| Median | $86,690 | $96,491 |
| Interquartile 25% (IQ1) | $73,174 | $81,678 |
| Interquartile 75% (IQ3) | $93,591 | $105,834 |
| Interquartile Range (IQR) | $20,417 | $24,156 |
| Standard Deviation (Sample) | $33,605 | $22,788 |
| Standard Deviation (Population) | $33,281 | $22,583 |
Similar Demographics by Householder Income Ages 25 - 44 years
Demographics Similar to Nigerians by Householder Income Ages 25 - 44 years
In terms of householder income ages 25 - 44 years, the demographic groups most similar to Nigerians are Nicaraguan ($87,751, a difference of 0.020%), Immigrants from Ghana ($87,760, a difference of 0.030%), Alaska Native ($88,018, a difference of 0.33%), Salvadoran ($88,198, a difference of 0.53%), and Immigrants from Cameroon ($88,214, a difference of 0.55%).
| Demographics | Rating | Rank | Householder Income Ages 25 - 44 years |
| Venezuelans | 2.9 /100 | #234 | Tragic $88,232 |
| Bermudans | 2.9 /100 | #235 | Tragic $88,231 |
| Immigrants | Cameroon | 2.9 /100 | #236 | Tragic $88,214 |
| Salvadorans | 2.8 /100 | #237 | Tragic $88,198 |
| Alaska Natives | 2.6 /100 | #238 | Tragic $88,018 |
| Immigrants | Ghana | 2.2 /100 | #239 | Tragic $87,760 |
| Nicaraguans | 2.2 /100 | #240 | Tragic $87,751 |
| Nigerians | 2.2 /100 | #241 | Tragic $87,730 |
| West Indians | 1.7 /100 | #242 | Tragic $87,205 |
| Immigrants | West Indies | 1.5 /100 | #243 | Tragic $87,063 |
| Immigrants | Venezuela | 1.5 /100 | #244 | Tragic $87,038 |
| Immigrants | El Salvador | 1.4 /100 | #245 | Tragic $86,913 |
| Immigrants | Burma/Myanmar | 1.3 /100 | #246 | Tragic $86,736 |
| Immigrants | Nigeria | 1.2 /100 | #247 | Tragic $86,589 |
| Immigrants | Sudan | 0.9 /100 | #248 | Tragic $86,109 |
Demographics Similar to Ethiopians by Householder Income Ages 25 - 44 years
In terms of householder income ages 25 - 44 years, the demographic groups most similar to Ethiopians are Norwegian ($96,866, a difference of 0.040%), Immigrants from Syria ($96,789, a difference of 0.040%), Irish ($96,730, a difference of 0.10%), Basque ($96,709, a difference of 0.12%), and Ugandan ($96,667, a difference of 0.16%).
| Demographics | Rating | Rank | Householder Income Ages 25 - 44 years |
| Immigrants | Peru | 82.2 /100 | #139 | Excellent $97,329 |
| Immigrants | Morocco | 82.0 /100 | #140 | Excellent $97,305 |
| Luxembourgers | 81.5 /100 | #141 | Excellent $97,237 |
| Danes | 81.3 /100 | #142 | Excellent $97,221 |
| Immigrants | Jordan | 81.0 /100 | #143 | Excellent $97,185 |
| Immigrants | Chile | 80.8 /100 | #144 | Excellent $97,159 |
| Norwegians | 78.2 /100 | #145 | Good $96,866 |
| Ethiopians | 77.8 /100 | #146 | Good $96,824 |
| Immigrants | Syria | 77.4 /100 | #147 | Good $96,789 |
| Irish | 76.9 /100 | #148 | Good $96,730 |
| Basques | 76.6 /100 | #149 | Good $96,709 |
| Ugandans | 76.2 /100 | #150 | Good $96,667 |
| Czechs | 74.8 /100 | #151 | Good $96,525 |
| South American Indians | 74.5 /100 | #152 | Good $96,497 |
| Slovenes | 73.9 /100 | #153 | Good $96,439 |