Immigrants from Norway vs Ethiopian Householder Income Ages 25 - 44 years
COMPARE
Immigrants from Norway
Ethiopian
Householder Income Ages 25 - 44 years
Householder Income Ages 25 - 44 years Comparison
Immigrants from Norway
Ethiopians
$106,629
HOUSEHOLDER INCOME AGES 25 - 44 YEARS
99.9/ 100
METRIC RATING
53rd/ 347
METRIC RANK
$96,824
HOUSEHOLDER INCOME AGES 25 - 44 YEARS
77.8/ 100
METRIC RATING
146th/ 347
METRIC RANK
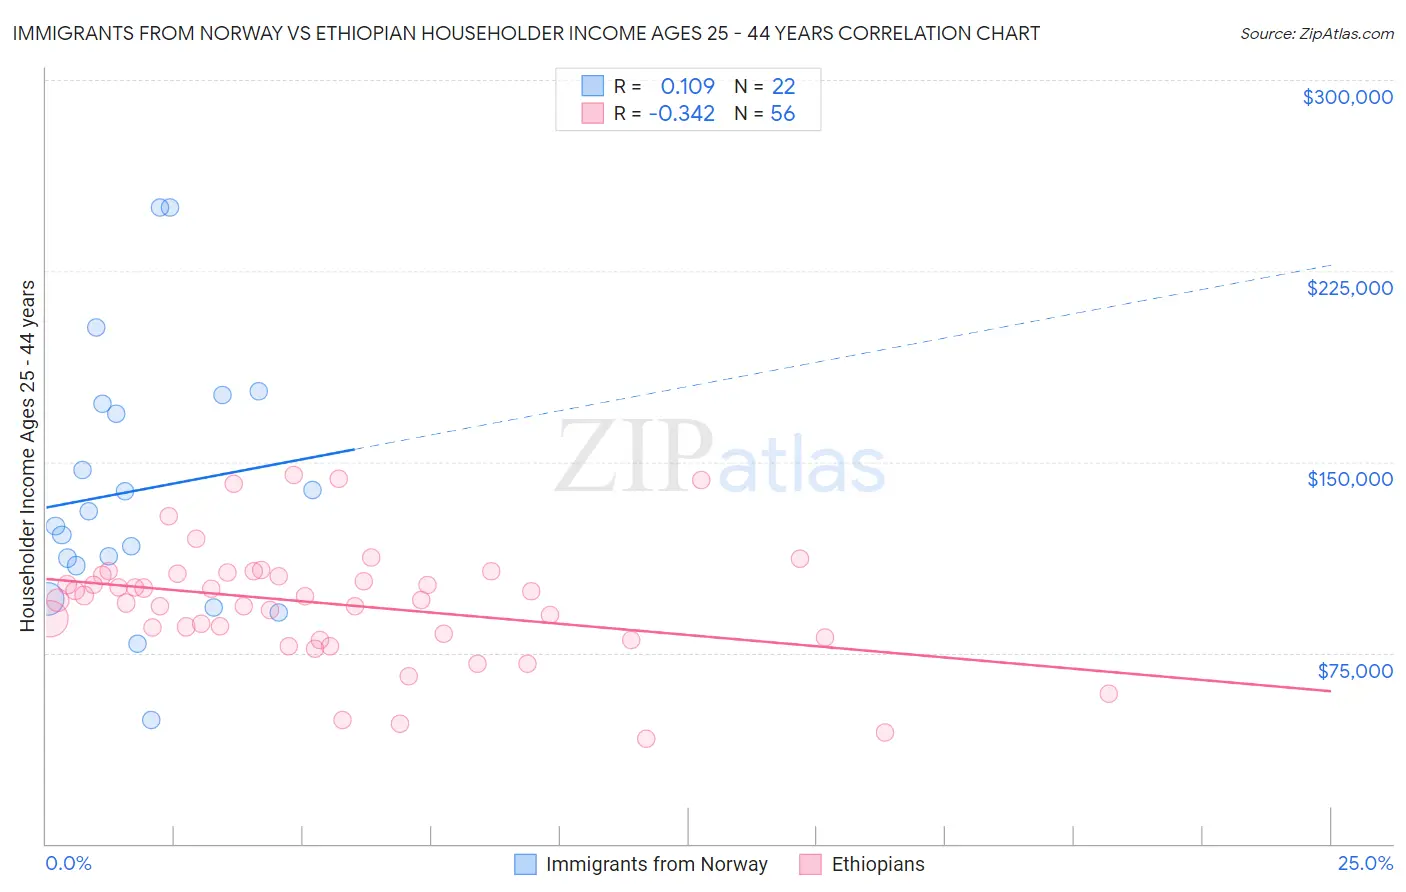
Immigrants from Norway vs Ethiopian Householder Income Ages 25 - 44 years Correlation Chart
The statistical analysis conducted on geographies consisting of 116,548,648 people shows a poor positive correlation between the proportion of Immigrants from Norway and household income with householder between the ages 25 and 44 in the United States with a correlation coefficient (R) of 0.109 and weighted average of $106,629. Similarly, the statistical analysis conducted on geographies consisting of 222,918,635 people shows a mild negative correlation between the proportion of Ethiopians and household income with householder between the ages 25 and 44 in the United States with a correlation coefficient (R) of -0.342 and weighted average of $96,824, a difference of 10.1%.
Householder Income Ages 25 - 44 years Correlation Summary
| Measurement | Immigrants from Norway | Ethiopian |
| Minimum | $48,750 | $41,159 |
| Maximum | $250,001 | $144,957 |
| Range | $201,251 | $103,798 |
| Mean | $138,956 | $94,277 |
| Median | $127,644 | $96,491 |
| Interquartile 25% (IQ1) | $109,255 | $81,678 |
| Interquartile 75% (IQ3) | $172,615 | $105,834 |
| Interquartile Range (IQR) | $63,360 | $24,156 |
| Standard Deviation (Sample) | $51,236 | $22,788 |
| Standard Deviation (Population) | $50,058 | $22,583 |
Similar Demographics by Householder Income Ages 25 - 44 years
Demographics Similar to Immigrants from Norway by Householder Income Ages 25 - 44 years
In terms of householder income ages 25 - 44 years, the demographic groups most similar to Immigrants from Norway are Paraguayan ($106,615, a difference of 0.010%), Greek ($106,457, a difference of 0.16%), Immigrants from Europe ($106,817, a difference of 0.18%), Immigrants from Czechoslovakia ($106,888, a difference of 0.24%), and Immigrants from Pakistan ($106,129, a difference of 0.47%).
| Demographics | Rating | Rank | Householder Income Ages 25 - 44 years |
| Immigrants | Belarus | 99.9 /100 | #46 | Exceptional $107,393 |
| Estonians | 99.9 /100 | #47 | Exceptional $107,269 |
| Bulgarians | 99.9 /100 | #48 | Exceptional $107,264 |
| Immigrants | Turkey | 99.9 /100 | #49 | Exceptional $107,258 |
| Cambodians | 99.9 /100 | #50 | Exceptional $107,148 |
| Immigrants | Czechoslovakia | 99.9 /100 | #51 | Exceptional $106,888 |
| Immigrants | Europe | 99.9 /100 | #52 | Exceptional $106,817 |
| Immigrants | Norway | 99.9 /100 | #53 | Exceptional $106,629 |
| Paraguayans | 99.9 /100 | #54 | Exceptional $106,615 |
| Greeks | 99.9 /100 | #55 | Exceptional $106,457 |
| Immigrants | Pakistan | 99.8 /100 | #56 | Exceptional $106,129 |
| Immigrants | Austria | 99.8 /100 | #57 | Exceptional $106,103 |
| Immigrants | South Africa | 99.8 /100 | #58 | Exceptional $105,748 |
| Immigrants | Latvia | 99.8 /100 | #59 | Exceptional $105,522 |
| Egyptians | 99.7 /100 | #60 | Exceptional $105,282 |
Demographics Similar to Ethiopians by Householder Income Ages 25 - 44 years
In terms of householder income ages 25 - 44 years, the demographic groups most similar to Ethiopians are Norwegian ($96,866, a difference of 0.040%), Immigrants from Syria ($96,789, a difference of 0.040%), Irish ($96,730, a difference of 0.10%), Basque ($96,709, a difference of 0.12%), and Ugandan ($96,667, a difference of 0.16%).
| Demographics | Rating | Rank | Householder Income Ages 25 - 44 years |
| Immigrants | Peru | 82.2 /100 | #139 | Excellent $97,329 |
| Immigrants | Morocco | 82.0 /100 | #140 | Excellent $97,305 |
| Luxembourgers | 81.5 /100 | #141 | Excellent $97,237 |
| Danes | 81.3 /100 | #142 | Excellent $97,221 |
| Immigrants | Jordan | 81.0 /100 | #143 | Excellent $97,185 |
| Immigrants | Chile | 80.8 /100 | #144 | Excellent $97,159 |
| Norwegians | 78.2 /100 | #145 | Good $96,866 |
| Ethiopians | 77.8 /100 | #146 | Good $96,824 |
| Immigrants | Syria | 77.4 /100 | #147 | Good $96,789 |
| Irish | 76.9 /100 | #148 | Good $96,730 |
| Basques | 76.6 /100 | #149 | Good $96,709 |
| Ugandans | 76.2 /100 | #150 | Good $96,667 |
| Czechs | 74.8 /100 | #151 | Good $96,525 |
| South American Indians | 74.5 /100 | #152 | Good $96,497 |
| Slovenes | 73.9 /100 | #153 | Good $96,439 |