European vs Ethiopian Householder Income Ages 25 - 44 years
COMPARE
European
Ethiopian
Householder Income Ages 25 - 44 years
Householder Income Ages 25 - 44 years Comparison
Europeans
Ethiopians
$98,310
HOUSEHOLDER INCOME AGES 25 - 44 YEARS
88.9/ 100
METRIC RATING
128th/ 347
METRIC RANK
$96,824
HOUSEHOLDER INCOME AGES 25 - 44 YEARS
77.8/ 100
METRIC RATING
146th/ 347
METRIC RANK
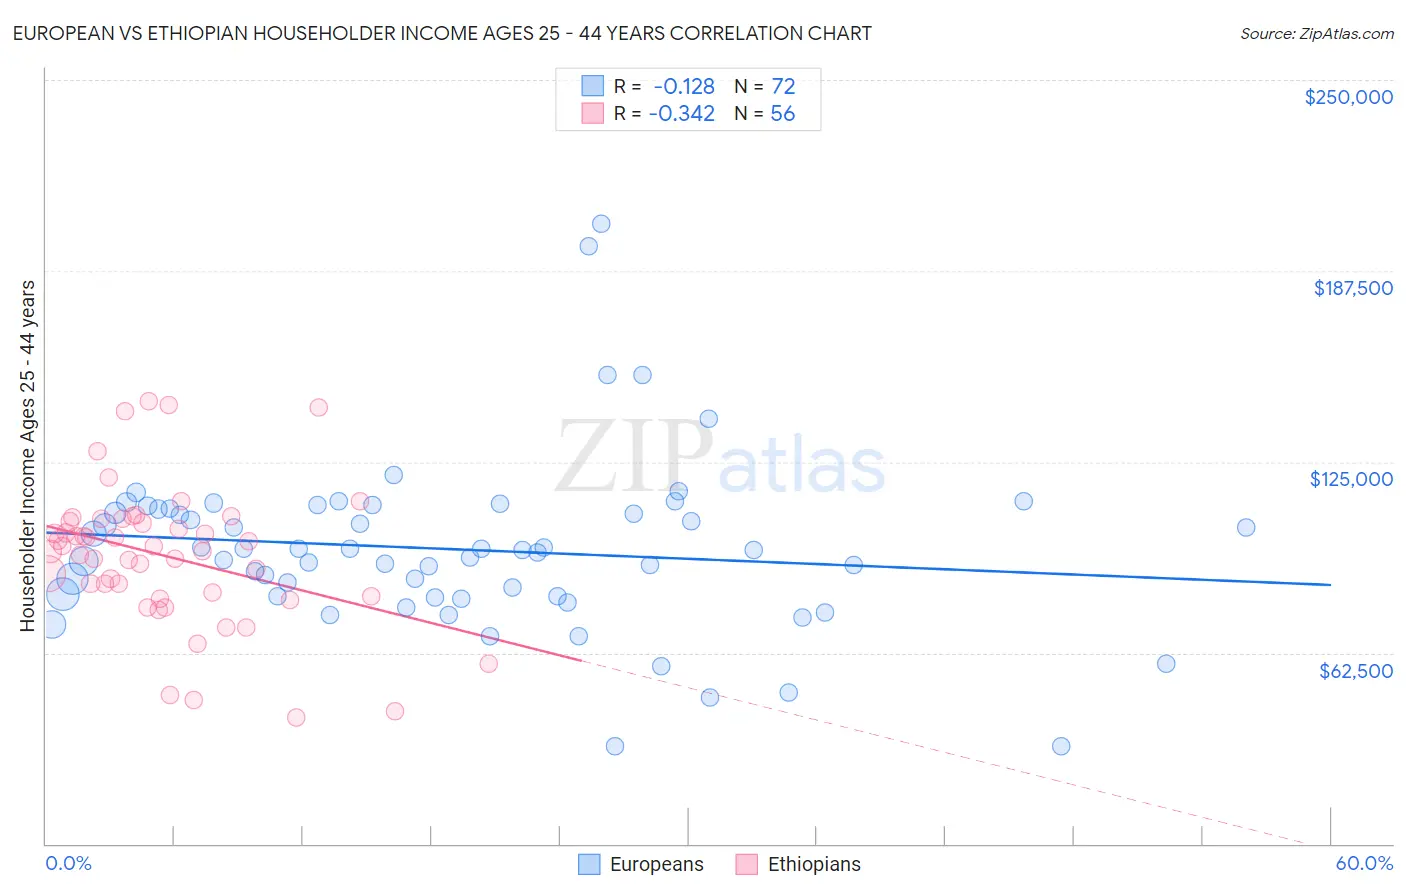
European vs Ethiopian Householder Income Ages 25 - 44 years Correlation Chart
The statistical analysis conducted on geographies consisting of 557,056,371 people shows a poor negative correlation between the proportion of Europeans and household income with householder between the ages 25 and 44 in the United States with a correlation coefficient (R) of -0.128 and weighted average of $98,310. Similarly, the statistical analysis conducted on geographies consisting of 222,918,635 people shows a mild negative correlation between the proportion of Ethiopians and household income with householder between the ages 25 and 44 in the United States with a correlation coefficient (R) of -0.342 and weighted average of $96,824, a difference of 1.5%.
Householder Income Ages 25 - 44 years Correlation Summary
| Measurement | European | Ethiopian |
| Minimum | $31,731 | $41,159 |
| Maximum | $202,785 | $144,957 |
| Range | $171,054 | $103,798 |
| Mean | $96,402 | $94,277 |
| Median | $96,268 | $96,491 |
| Interquartile 25% (IQ1) | $81,036 | $81,678 |
| Interquartile 75% (IQ3) | $109,601 | $105,834 |
| Interquartile Range (IQR) | $28,565 | $24,156 |
| Standard Deviation (Sample) | $28,192 | $22,788 |
| Standard Deviation (Population) | $27,996 | $22,583 |
Demographics Similar to Europeans and Ethiopians by Householder Income Ages 25 - 44 years
In terms of householder income ages 25 - 44 years, the demographic groups most similar to Europeans are Serbian ($98,320, a difference of 0.010%), Brazilian ($98,267, a difference of 0.040%), Immigrants from Kuwait ($98,122, a difference of 0.19%), Immigrants from Albania ($97,929, a difference of 0.39%), and Immigrants from Zimbabwe ($97,880, a difference of 0.44%). Similarly, the demographic groups most similar to Ethiopians are Norwegian ($96,866, a difference of 0.040%), Immigrants from Syria ($96,789, a difference of 0.040%), Immigrants from Chile ($97,159, a difference of 0.35%), Immigrants from Jordan ($97,185, a difference of 0.37%), and Danish ($97,221, a difference of 0.41%).
| Demographics | Rating | Rank | Householder Income Ages 25 - 44 years |
| Serbians | 88.9 /100 | #127 | Excellent $98,320 |
| Europeans | 88.9 /100 | #128 | Excellent $98,310 |
| Brazilians | 88.6 /100 | #129 | Excellent $98,267 |
| Immigrants | Kuwait | 87.8 /100 | #130 | Excellent $98,122 |
| Immigrants | Albania | 86.6 /100 | #131 | Excellent $97,929 |
| Immigrants | Zimbabwe | 86.3 /100 | #132 | Excellent $97,880 |
| Tsimshian | 85.8 /100 | #133 | Excellent $97,809 |
| Canadians | 84.5 /100 | #134 | Excellent $97,625 |
| Immigrants | Oceania | 84.5 /100 | #135 | Excellent $97,623 |
| Hungarians | 83.9 /100 | #136 | Excellent $97,544 |
| Lebanese | 82.3 /100 | #137 | Excellent $97,339 |
| Arabs | 82.3 /100 | #138 | Excellent $97,336 |
| Immigrants | Peru | 82.2 /100 | #139 | Excellent $97,329 |
| Immigrants | Morocco | 82.0 /100 | #140 | Excellent $97,305 |
| Luxembourgers | 81.5 /100 | #141 | Excellent $97,237 |
| Danes | 81.3 /100 | #142 | Excellent $97,221 |
| Immigrants | Jordan | 81.0 /100 | #143 | Excellent $97,185 |
| Immigrants | Chile | 80.8 /100 | #144 | Excellent $97,159 |
| Norwegians | 78.2 /100 | #145 | Good $96,866 |
| Ethiopians | 77.8 /100 | #146 | Good $96,824 |
| Immigrants | Syria | 77.4 /100 | #147 | Good $96,789 |