Hungarian vs Costa Rican Median Household Income
COMPARE
Hungarian
Costa Rican
Median Household Income
Median Household Income Comparison
Hungarians
Costa Ricans
$86,920
MEDIAN HOUSEHOLD INCOME
76.3/ 100
METRIC RATING
151st/ 347
METRIC RANK
$87,262
MEDIAN HOUSEHOLD INCOME
80.0/ 100
METRIC RATING
148th/ 347
METRIC RANK
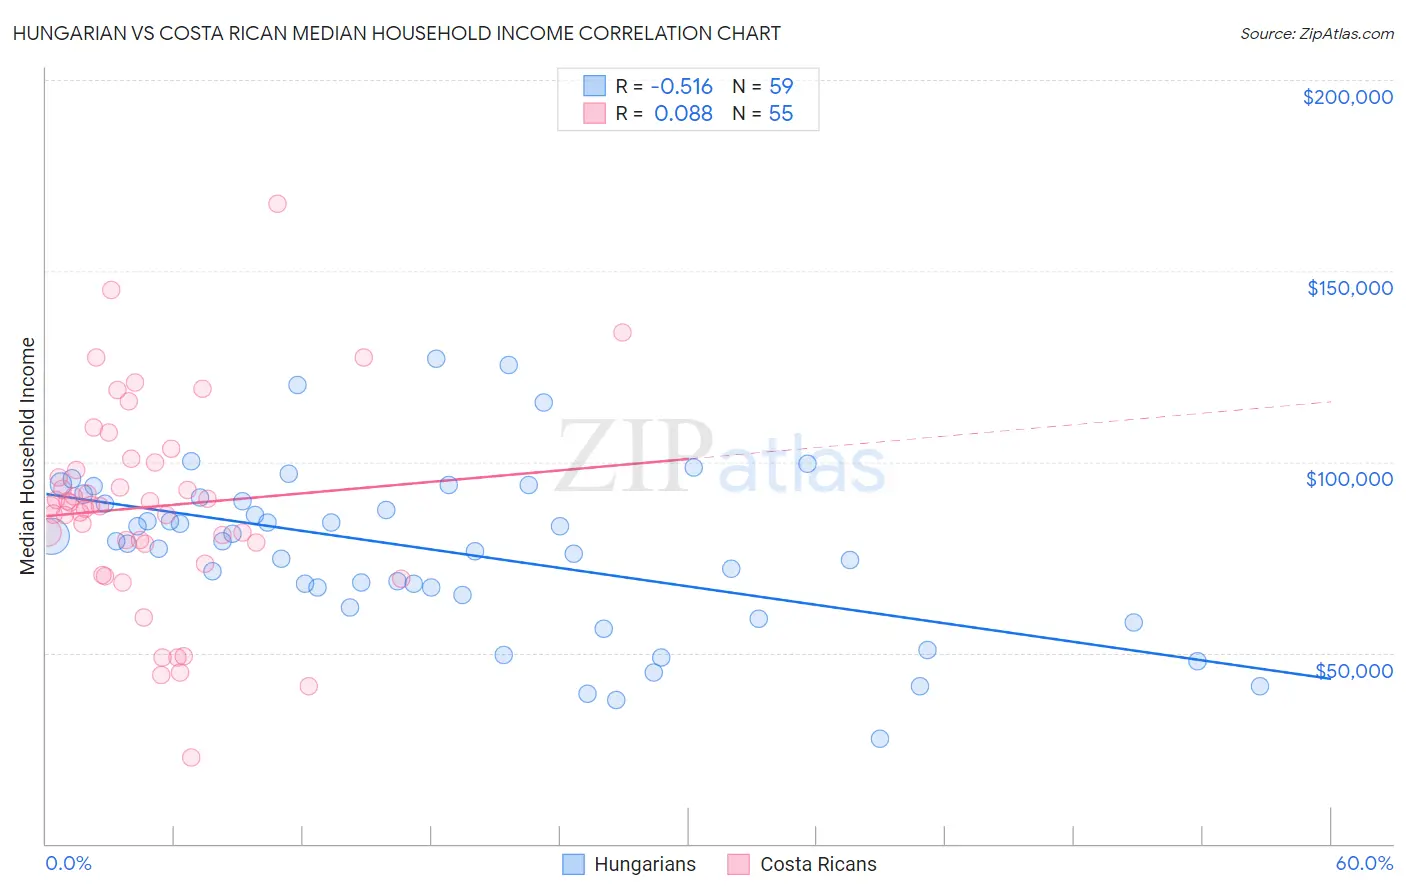
Hungarian vs Costa Rican Median Household Income Correlation Chart
The statistical analysis conducted on geographies consisting of 485,741,386 people shows a substantial negative correlation between the proportion of Hungarians and median household income in the United States with a correlation coefficient (R) of -0.516 and weighted average of $86,920. Similarly, the statistical analysis conducted on geographies consisting of 253,413,856 people shows a slight positive correlation between the proportion of Costa Ricans and median household income in the United States with a correlation coefficient (R) of 0.088 and weighted average of $87,262, a difference of 0.39%.
Median Household Income Correlation Summary
| Measurement | Hungarian | Costa Rican |
| Minimum | $27,488 | $22,708 |
| Maximum | $127,161 | $167,647 |
| Range | $99,673 | $144,939 |
| Mean | $76,828 | $88,260 |
| Median | $79,103 | $88,335 |
| Interquartile 25% (IQ1) | $65,060 | $78,591 |
| Interquartile 75% (IQ3) | $90,559 | $99,928 |
| Interquartile Range (IQR) | $25,499 | $21,337 |
| Standard Deviation (Sample) | $21,600 | $26,495 |
| Standard Deviation (Population) | $21,417 | $26,253 |
Demographics Similar to Hungarians and Costa Ricans by Median Household Income
In terms of median household income, the demographic groups most similar to Hungarians are Immigrants from Saudi Arabia ($86,875, a difference of 0.050%), Basque ($87,001, a difference of 0.090%), South American ($86,824, a difference of 0.11%), Immigrants from Nepal ($87,046, a difference of 0.15%), and Immigrants from Germany ($86,764, a difference of 0.18%). Similarly, the demographic groups most similar to Costa Ricans are South American Indian ($87,446, a difference of 0.21%), Immigrants from Nepal ($87,046, a difference of 0.25%), Basque ($87,001, a difference of 0.30%), Immigrants from Uganda ($87,553, a difference of 0.33%), and Ugandan ($87,557, a difference of 0.34%).
| Demographics | Rating | Rank | Median Household Income |
| Immigrants | Chile | 89.2 /100 | #139 | Excellent $88,388 |
| Lebanese | 87.2 /100 | #140 | Excellent $88,091 |
| Immigrants | Morocco | 86.0 /100 | #141 | Excellent $87,930 |
| Canadians | 84.7 /100 | #142 | Excellent $87,769 |
| Danes | 83.9 /100 | #143 | Excellent $87,676 |
| Serbians | 83.0 /100 | #144 | Excellent $87,572 |
| Ugandans | 82.9 /100 | #145 | Excellent $87,557 |
| Immigrants | Uganda | 82.8 /100 | #146 | Excellent $87,553 |
| South American Indians | 81.8 /100 | #147 | Excellent $87,446 |
| Costa Ricans | 80.0 /100 | #148 | Excellent $87,262 |
| Immigrants | Nepal | 77.7 /100 | #149 | Good $87,046 |
| Basques | 77.2 /100 | #150 | Good $87,001 |
| Hungarians | 76.3 /100 | #151 | Good $86,920 |
| Immigrants | Saudi Arabia | 75.8 /100 | #152 | Good $86,875 |
| South Americans | 75.1 /100 | #153 | Good $86,824 |
| Immigrants | Germany | 74.4 /100 | #154 | Good $86,764 |
| Carpatho Rusyns | 72.8 /100 | #155 | Good $86,635 |
| Immigrants | Albania | 71.5 /100 | #156 | Good $86,534 |
| Samoans | 71.0 /100 | #157 | Good $86,498 |
| Moroccans | 70.6 /100 | #158 | Good $86,468 |
| Immigrants | Uzbekistan | 70.1 /100 | #159 | Good $86,425 |