Hungarian vs Immigrants from Burma/Myanmar Median Household Income
COMPARE
Hungarian
Immigrants from Burma/Myanmar
Median Household Income
Median Household Income Comparison
Hungarians
Immigrants from Burma/Myanmar
$86,920
MEDIAN HOUSEHOLD INCOME
76.3/ 100
METRIC RATING
151st/ 347
METRIC RANK
$78,682
MEDIAN HOUSEHOLD INCOME
1.6/ 100
METRIC RATING
247th/ 347
METRIC RANK
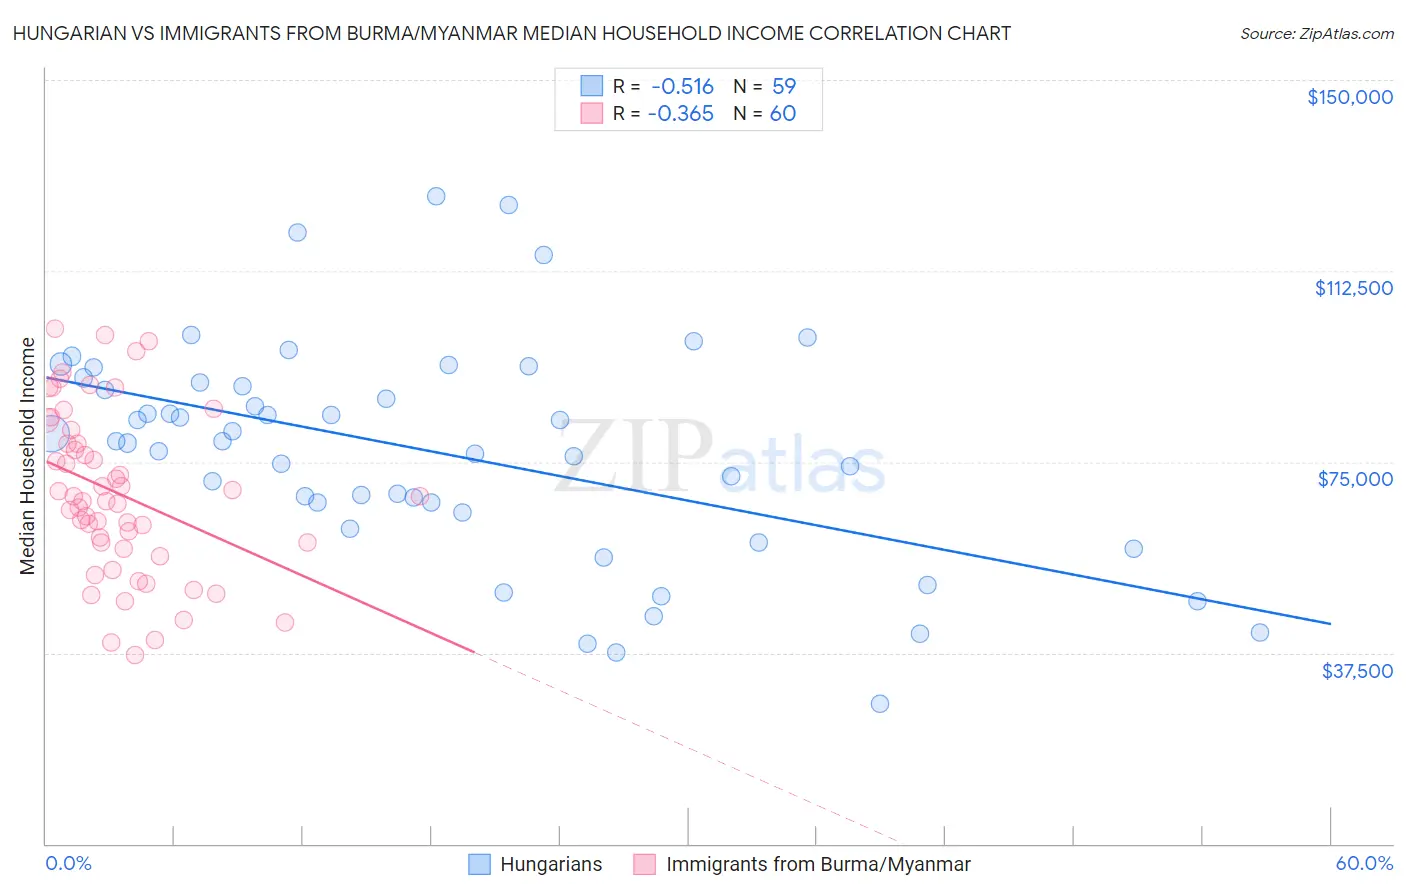
Hungarian vs Immigrants from Burma/Myanmar Median Household Income Correlation Chart
The statistical analysis conducted on geographies consisting of 485,741,386 people shows a substantial negative correlation between the proportion of Hungarians and median household income in the United States with a correlation coefficient (R) of -0.516 and weighted average of $86,920. Similarly, the statistical analysis conducted on geographies consisting of 172,235,466 people shows a mild negative correlation between the proportion of Immigrants from Burma/Myanmar and median household income in the United States with a correlation coefficient (R) of -0.365 and weighted average of $78,682, a difference of 10.5%.
Median Household Income Correlation Summary
| Measurement | Hungarian | Immigrants from Burma/Myanmar |
| Minimum | $27,488 | $36,966 |
| Maximum | $127,161 | $101,230 |
| Range | $99,673 | $64,264 |
| Mean | $76,828 | $68,823 |
| Median | $79,103 | $67,779 |
| Interquartile 25% (IQ1) | $65,060 | $58,487 |
| Interquartile 75% (IQ3) | $90,559 | $79,866 |
| Interquartile Range (IQR) | $25,499 | $21,379 |
| Standard Deviation (Sample) | $21,600 | $16,228 |
| Standard Deviation (Population) | $21,417 | $16,092 |
Similar Demographics by Median Household Income
Demographics Similar to Hungarians by Median Household Income
In terms of median household income, the demographic groups most similar to Hungarians are Immigrants from Saudi Arabia ($86,875, a difference of 0.050%), Basque ($87,001, a difference of 0.090%), South American ($86,824, a difference of 0.11%), Immigrants from Nepal ($87,046, a difference of 0.15%), and Immigrants from Germany ($86,764, a difference of 0.18%).
| Demographics | Rating | Rank | Median Household Income |
| Serbians | 83.0 /100 | #144 | Excellent $87,572 |
| Ugandans | 82.9 /100 | #145 | Excellent $87,557 |
| Immigrants | Uganda | 82.8 /100 | #146 | Excellent $87,553 |
| South American Indians | 81.8 /100 | #147 | Excellent $87,446 |
| Costa Ricans | 80.0 /100 | #148 | Excellent $87,262 |
| Immigrants | Nepal | 77.7 /100 | #149 | Good $87,046 |
| Basques | 77.2 /100 | #150 | Good $87,001 |
| Hungarians | 76.3 /100 | #151 | Good $86,920 |
| Immigrants | Saudi Arabia | 75.8 /100 | #152 | Good $86,875 |
| South Americans | 75.1 /100 | #153 | Good $86,824 |
| Immigrants | Germany | 74.4 /100 | #154 | Good $86,764 |
| Carpatho Rusyns | 72.8 /100 | #155 | Good $86,635 |
| Immigrants | Albania | 71.5 /100 | #156 | Good $86,534 |
| Samoans | 71.0 /100 | #157 | Good $86,498 |
| Moroccans | 70.6 /100 | #158 | Good $86,468 |
Demographics Similar to Immigrants from Burma/Myanmar by Median Household Income
In terms of median household income, the demographic groups most similar to Immigrants from Burma/Myanmar are Central American ($78,803, a difference of 0.15%), Sudanese ($78,529, a difference of 0.19%), Inupiat ($78,841, a difference of 0.20%), West Indian ($78,455, a difference of 0.29%), and Marshallese ($78,930, a difference of 0.32%).
| Demographics | Rating | Rank | Median Household Income |
| Immigrants | Western Africa | 2.7 /100 | #240 | Tragic $79,490 |
| Immigrants | Nonimmigrants | 2.6 /100 | #241 | Tragic $79,429 |
| Immigrants | Sudan | 2.1 /100 | #242 | Tragic $79,103 |
| Immigrants | Barbados | 1.9 /100 | #243 | Tragic $78,989 |
| Marshallese | 1.9 /100 | #244 | Tragic $78,930 |
| Inupiat | 1.8 /100 | #245 | Tragic $78,841 |
| Central Americans | 1.7 /100 | #246 | Tragic $78,803 |
| Immigrants | Burma/Myanmar | 1.6 /100 | #247 | Tragic $78,682 |
| Sudanese | 1.5 /100 | #248 | Tragic $78,529 |
| West Indians | 1.4 /100 | #249 | Tragic $78,455 |
| Immigrants | Laos | 1.3 /100 | #250 | Tragic $78,327 |
| Mexican American Indians | 1.2 /100 | #251 | Tragic $78,166 |
| Immigrants | West Indies | 1.0 /100 | #252 | Tragic $77,956 |
| Immigrants | St. Vincent and the Grenadines | 0.9 /100 | #253 | Tragic $77,690 |
| Sub-Saharan Africans | 0.8 /100 | #254 | Tragic $77,631 |