Hungarian vs Russian Median Household Income
COMPARE
Hungarian
Russian
Median Household Income
Median Household Income Comparison
Hungarians
Russians
$86,920
MEDIAN HOUSEHOLD INCOME
76.3/ 100
METRIC RATING
151st/ 347
METRIC RANK
$98,008
MEDIAN HOUSEHOLD INCOME
100.0/ 100
METRIC RATING
34th/ 347
METRIC RANK
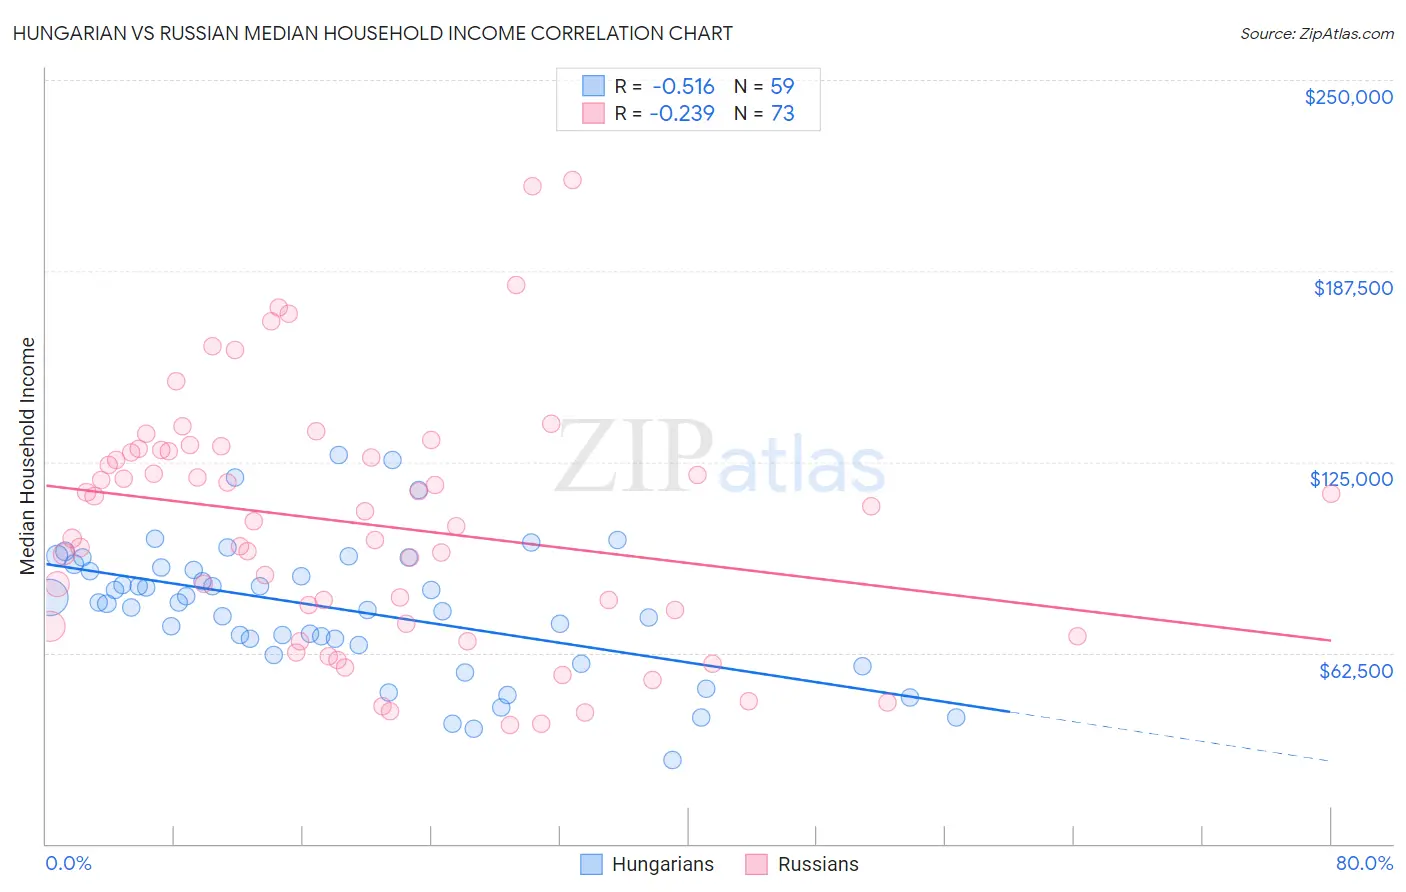
Hungarian vs Russian Median Household Income Correlation Chart
The statistical analysis conducted on geographies consisting of 485,741,386 people shows a substantial negative correlation between the proportion of Hungarians and median household income in the United States with a correlation coefficient (R) of -0.516 and weighted average of $86,920. Similarly, the statistical analysis conducted on geographies consisting of 511,515,990 people shows a weak negative correlation between the proportion of Russians and median household income in the United States with a correlation coefficient (R) of -0.239 and weighted average of $98,008, a difference of 12.8%.
Median Household Income Correlation Summary
| Measurement | Hungarian | Russian |
| Minimum | $27,488 | $38,750 |
| Maximum | $127,161 | $217,375 |
| Range | $99,673 | $178,625 |
| Mean | $76,828 | $104,714 |
| Median | $79,103 | $105,523 |
| Interquartile 25% (IQ1) | $65,060 | $71,539 |
| Interquartile 75% (IQ3) | $90,559 | $128,679 |
| Interquartile Range (IQR) | $25,499 | $57,140 |
| Standard Deviation (Sample) | $21,600 | $40,584 |
| Standard Deviation (Population) | $21,417 | $40,305 |
Similar Demographics by Median Household Income
Demographics Similar to Hungarians by Median Household Income
In terms of median household income, the demographic groups most similar to Hungarians are Immigrants from Saudi Arabia ($86,875, a difference of 0.050%), Basque ($87,001, a difference of 0.090%), South American ($86,824, a difference of 0.11%), Immigrants from Nepal ($87,046, a difference of 0.15%), and Immigrants from Germany ($86,764, a difference of 0.18%).
| Demographics | Rating | Rank | Median Household Income |
| Serbians | 83.0 /100 | #144 | Excellent $87,572 |
| Ugandans | 82.9 /100 | #145 | Excellent $87,557 |
| Immigrants | Uganda | 82.8 /100 | #146 | Excellent $87,553 |
| South American Indians | 81.8 /100 | #147 | Excellent $87,446 |
| Costa Ricans | 80.0 /100 | #148 | Excellent $87,262 |
| Immigrants | Nepal | 77.7 /100 | #149 | Good $87,046 |
| Basques | 77.2 /100 | #150 | Good $87,001 |
| Hungarians | 76.3 /100 | #151 | Good $86,920 |
| Immigrants | Saudi Arabia | 75.8 /100 | #152 | Good $86,875 |
| South Americans | 75.1 /100 | #153 | Good $86,824 |
| Immigrants | Germany | 74.4 /100 | #154 | Good $86,764 |
| Carpatho Rusyns | 72.8 /100 | #155 | Good $86,635 |
| Immigrants | Albania | 71.5 /100 | #156 | Good $86,534 |
| Samoans | 71.0 /100 | #157 | Good $86,498 |
| Moroccans | 70.6 /100 | #158 | Good $86,468 |
Demographics Similar to Russians by Median Household Income
In terms of median household income, the demographic groups most similar to Russians are Immigrants from Switzerland ($97,979, a difference of 0.030%), Immigrants from Pakistan ($97,528, a difference of 0.49%), Chinese ($98,496, a difference of 0.50%), Immigrants from Denmark ($98,510, a difference of 0.51%), and Latvian ($97,311, a difference of 0.72%).
| Demographics | Rating | Rank | Median Household Income |
| Bhutanese | 100.0 /100 | #27 | Exceptional $100,151 |
| Immigrants | Sri Lanka | 100.0 /100 | #28 | Exceptional $99,943 |
| Immigrants | Asia | 100.0 /100 | #29 | Exceptional $99,933 |
| Immigrants | Northern Europe | 100.0 /100 | #30 | Exceptional $99,813 |
| Turks | 100.0 /100 | #31 | Exceptional $99,389 |
| Immigrants | Denmark | 100.0 /100 | #32 | Exceptional $98,510 |
| Chinese | 100.0 /100 | #33 | Exceptional $98,496 |
| Russians | 100.0 /100 | #34 | Exceptional $98,008 |
| Immigrants | Switzerland | 100.0 /100 | #35 | Exceptional $97,979 |
| Immigrants | Pakistan | 100.0 /100 | #36 | Exceptional $97,528 |
| Latvians | 100.0 /100 | #37 | Exceptional $97,311 |
| Immigrants | Indonesia | 100.0 /100 | #38 | Exceptional $97,297 |
| Afghans | 100.0 /100 | #39 | Exceptional $97,026 |
| Maltese | 100.0 /100 | #40 | Exceptional $97,015 |
| Immigrants | Turkey | 100.0 /100 | #41 | Exceptional $96,964 |