Hungarian vs Costa Rican Median Family Income
COMPARE
Hungarian
Costa Rican
Median Family Income
Median Family Income Comparison
Hungarians
Costa Ricans
$105,609
MEDIAN FAMILY INCOME
81.7/ 100
METRIC RATING
148th/ 347
METRIC RANK
$103,989
MEDIAN FAMILY INCOME
66.2/ 100
METRIC RATING
163rd/ 347
METRIC RANK
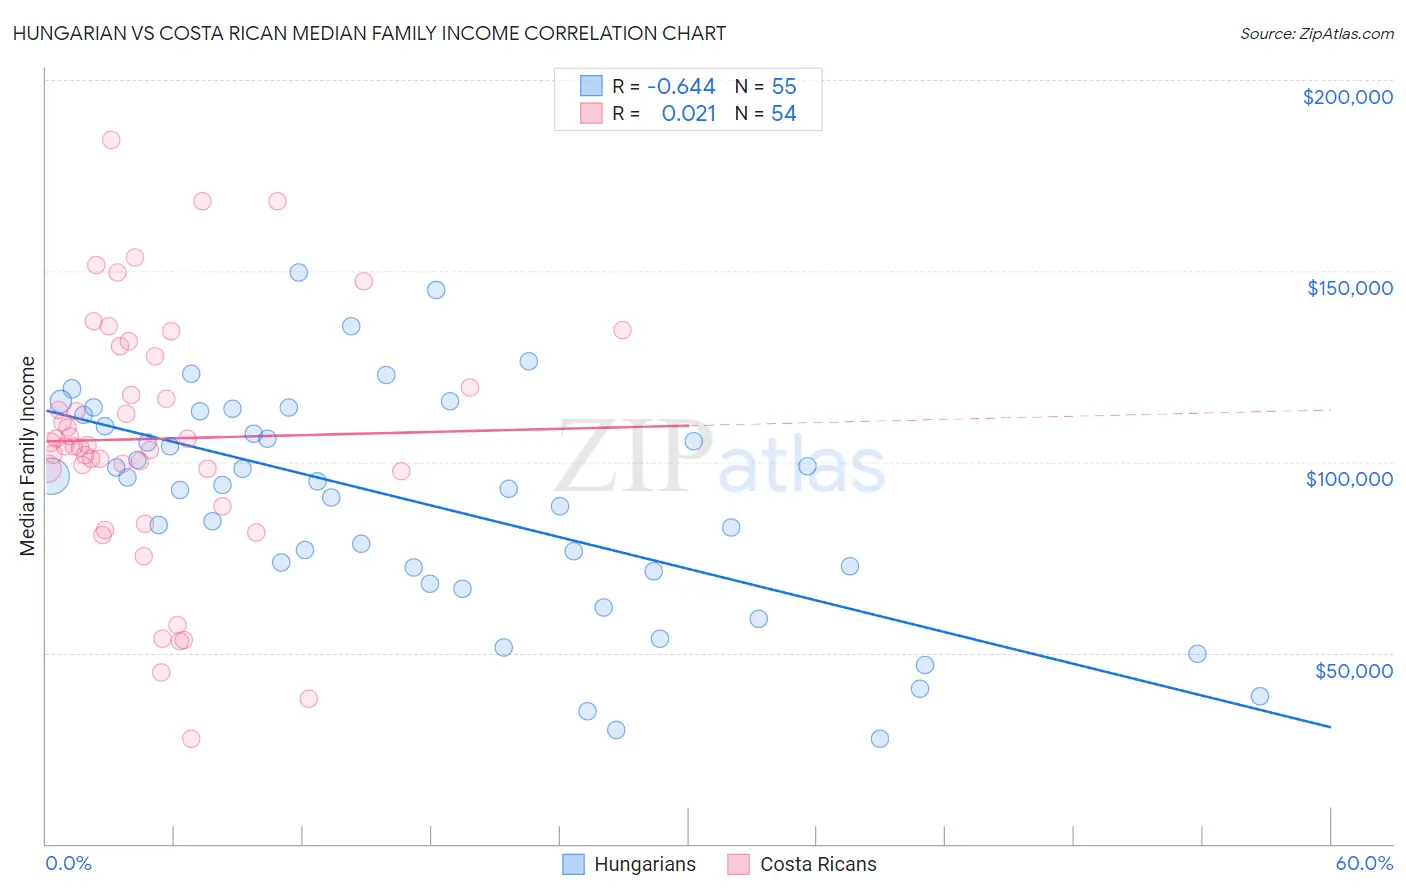
Hungarian vs Costa Rican Median Family Income Correlation Chart
The statistical analysis conducted on geographies consisting of 485,642,257 people shows a significant negative correlation between the proportion of Hungarians and median family income in the United States with a correlation coefficient (R) of -0.644 and weighted average of $105,609. Similarly, the statistical analysis conducted on geographies consisting of 253,398,040 people shows no correlation between the proportion of Costa Ricans and median family income in the United States with a correlation coefficient (R) of 0.021 and weighted average of $103,989, a difference of 1.6%.
Median Family Income Correlation Summary
| Measurement | Hungarian | Costa Rican |
| Minimum | $27,438 | $27,614 |
| Maximum | $149,519 | $184,403 |
| Range | $122,081 | $156,789 |
| Mean | $89,113 | $106,057 |
| Median | $94,101 | $104,255 |
| Interquartile 25% (IQ1) | $71,250 | $97,569 |
| Interquartile 75% (IQ3) | $112,341 | $127,528 |
| Interquartile Range (IQR) | $41,091 | $29,959 |
| Standard Deviation (Sample) | $29,093 | $32,745 |
| Standard Deviation (Population) | $28,828 | $32,441 |
Demographics Similar to Hungarians and Costa Ricans by Median Family Income
In terms of median family income, the demographic groups most similar to Hungarians are Immigrants from Chile ($105,655, a difference of 0.040%), Immigrants from Germany ($105,507, a difference of 0.10%), Irish ($105,453, a difference of 0.15%), Peruvian ($105,444, a difference of 0.16%), and Czech ($105,839, a difference of 0.22%). Similarly, the demographic groups most similar to Costa Ricans are Immigrants from Sierra Leone ($103,990, a difference of 0.0%), Sierra Leonean ($103,859, a difference of 0.13%), Slovak ($103,729, a difference of 0.25%), Icelander ($104,282, a difference of 0.28%), and Scottish ($104,288, a difference of 0.29%).
| Demographics | Rating | Rank | Median Family Income |
| Danes | 83.8 /100 | #145 | Excellent $105,900 |
| Czechs | 83.4 /100 | #146 | Excellent $105,839 |
| Immigrants | Chile | 82.1 /100 | #147 | Excellent $105,655 |
| Hungarians | 81.7 /100 | #148 | Excellent $105,609 |
| Immigrants | Germany | 80.9 /100 | #149 | Excellent $105,507 |
| Irish | 80.5 /100 | #150 | Excellent $105,453 |
| Peruvians | 80.4 /100 | #151 | Excellent $105,444 |
| Immigrants | Albania | 79.1 /100 | #152 | Good $105,285 |
| Slavs | 77.9 /100 | #153 | Good $105,144 |
| Immigrants | Nepal | 76.3 /100 | #154 | Good $104,966 |
| Native Hawaiians | 75.8 /100 | #155 | Good $104,910 |
| Basques | 74.4 /100 | #156 | Good $104,760 |
| Moroccans | 71.6 /100 | #157 | Good $104,488 |
| Scandinavians | 70.8 /100 | #158 | Good $104,410 |
| Swiss | 70.7 /100 | #159 | Good $104,396 |
| Scottish | 69.5 /100 | #160 | Good $104,288 |
| Icelanders | 69.4 /100 | #161 | Good $104,282 |
| Immigrants | Sierra Leone | 66.2 /100 | #162 | Good $103,990 |
| Costa Ricans | 66.2 /100 | #163 | Good $103,989 |
| Sierra Leoneans | 64.7 /100 | #164 | Good $103,859 |
| Slovaks | 63.1 /100 | #165 | Good $103,729 |