Hungarian vs Costa Rican Male Unemployment
COMPARE
Hungarian
Costa Rican
Male Unemployment
Male Unemployment Comparison
Hungarians
Costa Ricans
5.2%
MALE UNEMPLOYMENT
85.1/ 100
METRIC RATING
128th/ 347
METRIC RANK
5.4%
MALE UNEMPLOYMENT
31.3/ 100
METRIC RATING
187th/ 347
METRIC RANK
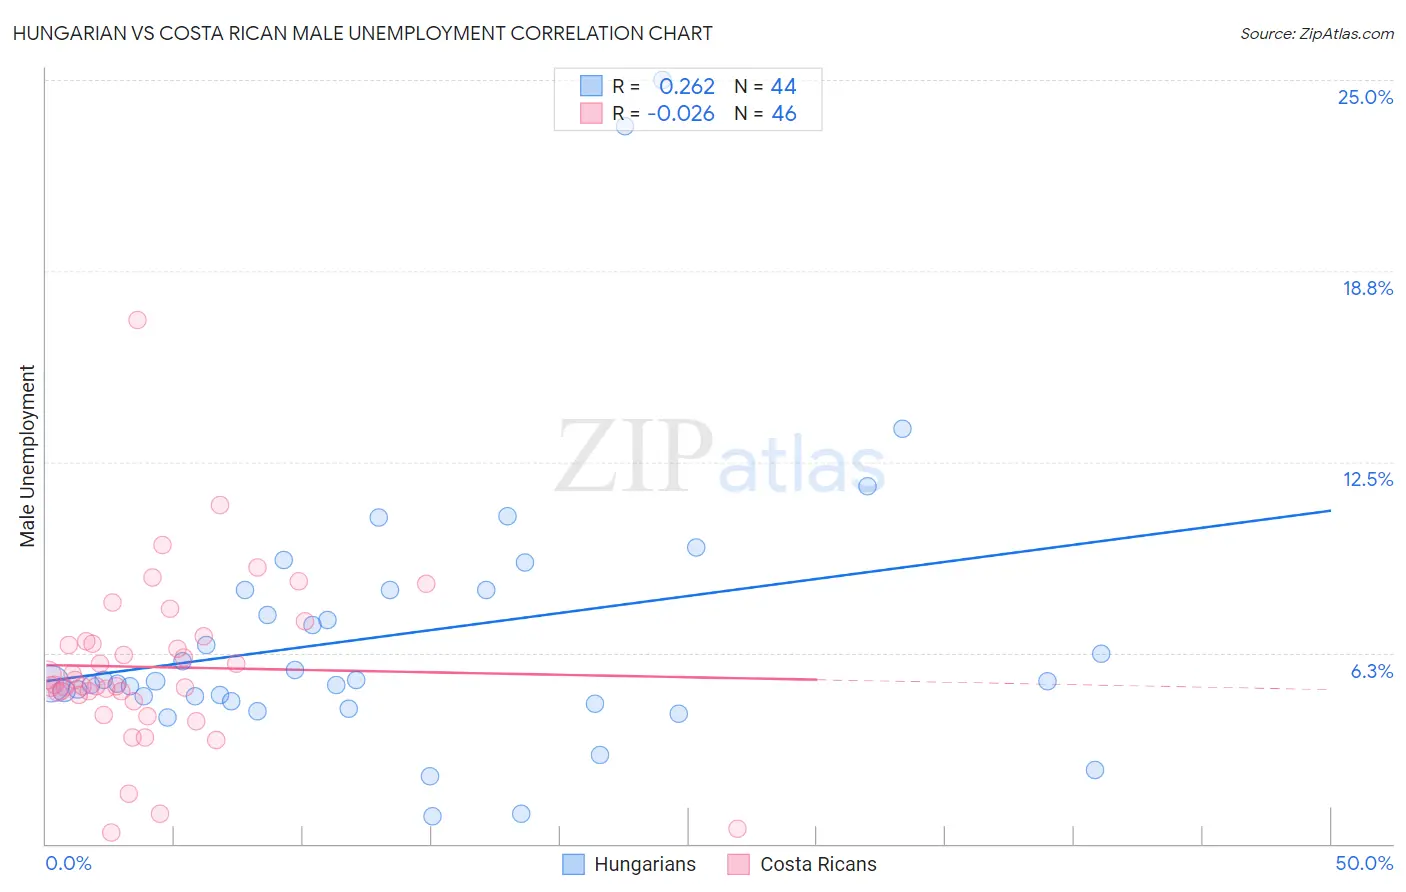
Hungarian vs Costa Rican Male Unemployment Correlation Chart
The statistical analysis conducted on geographies consisting of 482,025,300 people shows a weak positive correlation between the proportion of Hungarians and unemployment rate among males in the United States with a correlation coefficient (R) of 0.262 and weighted average of 5.2%. Similarly, the statistical analysis conducted on geographies consisting of 253,200,475 people shows no correlation between the proportion of Costa Ricans and unemployment rate among males in the United States with a correlation coefficient (R) of -0.026 and weighted average of 5.4%, a difference of 3.8%.
Male Unemployment Correlation Summary
| Measurement | Hungarian | Costa Rican |
| Minimum | 0.92% | 0.35% |
| Maximum | 25.0% | 17.2% |
| Range | 24.1% | 16.8% |
| Mean | 6.9% | 5.8% |
| Median | 5.3% | 5.2% |
| Interquartile 25% (IQ1) | 4.7% | 4.9% |
| Interquartile 75% (IQ3) | 8.3% | 6.6% |
| Interquartile Range (IQR) | 3.6% | 1.8% |
| Standard Deviation (Sample) | 4.7% | 2.8% |
| Standard Deviation (Population) | 4.6% | 2.8% |
Similar Demographics by Male Unemployment
Demographics Similar to Hungarians by Male Unemployment
In terms of male unemployment, the demographic groups most similar to Hungarians are Immigrants from Western Europe (5.2%, a difference of 0.030%), Immigrants from Brazil (5.2%, a difference of 0.15%), Immigrants from Malaysia (5.2%, a difference of 0.18%), Immigrants from Colombia (5.1%, a difference of 0.21%), and Immigrants from Germany (5.2%, a difference of 0.23%).
| Demographics | Rating | Rank | Male Unemployment |
| Mongolians | 88.4 /100 | #121 | Excellent 5.1% |
| Nicaraguans | 88.2 /100 | #122 | Excellent 5.1% |
| Palestinians | 87.7 /100 | #123 | Excellent 5.1% |
| Immigrants | Latvia | 87.5 /100 | #124 | Excellent 5.1% |
| Immigrants | Lithuania | 87.2 /100 | #125 | Excellent 5.1% |
| Immigrants | Colombia | 86.8 /100 | #126 | Excellent 5.1% |
| Immigrants | Brazil | 86.3 /100 | #127 | Excellent 5.2% |
| Hungarians | 85.1 /100 | #128 | Excellent 5.2% |
| Immigrants | Western Europe | 84.8 /100 | #129 | Excellent 5.2% |
| Immigrants | Malaysia | 83.5 /100 | #130 | Excellent 5.2% |
| Immigrants | Germany | 83.0 /100 | #131 | Excellent 5.2% |
| Chickasaw | 82.9 /100 | #132 | Excellent 5.2% |
| Colombians | 81.1 /100 | #133 | Excellent 5.2% |
| Pakistanis | 80.5 /100 | #134 | Excellent 5.2% |
| Immigrants | Saudi Arabia | 80.1 /100 | #135 | Excellent 5.2% |
Demographics Similar to Costa Ricans by Male Unemployment
In terms of male unemployment, the demographic groups most similar to Costa Ricans are Iraqi (5.4%, a difference of 0.010%), Arab (5.4%, a difference of 0.080%), Immigrants from South America (5.4%, a difference of 0.13%), Immigrants from Uganda (5.4%, a difference of 0.18%), and Immigrants from South Eastern Asia (5.4%, a difference of 0.21%).
| Demographics | Rating | Rank | Male Unemployment |
| Malaysians | 39.6 /100 | #180 | Fair 5.3% |
| Immigrants | Afghanistan | 37.9 /100 | #181 | Fair 5.3% |
| Potawatomi | 37.8 /100 | #182 | Fair 5.3% |
| Taiwanese | 37.6 /100 | #183 | Fair 5.3% |
| Spaniards | 35.1 /100 | #184 | Fair 5.3% |
| Koreans | 34.9 /100 | #185 | Fair 5.3% |
| Iraqis | 31.6 /100 | #186 | Fair 5.4% |
| Costa Ricans | 31.3 /100 | #187 | Fair 5.4% |
| Arabs | 30.2 /100 | #188 | Fair 5.4% |
| Immigrants | South America | 29.4 /100 | #189 | Fair 5.4% |
| Immigrants | Uganda | 28.8 /100 | #190 | Fair 5.4% |
| Immigrants | South Eastern Asia | 28.2 /100 | #191 | Fair 5.4% |
| Immigrants | Belarus | 26.0 /100 | #192 | Fair 5.4% |
| Immigrants | Israel | 25.2 /100 | #193 | Fair 5.4% |
| Spanish | 19.7 /100 | #194 | Poor 5.4% |