Hungarian vs Costa Rican Associate's Degree
COMPARE
Hungarian
Costa Rican
Associate's Degree
Associate's Degree Comparison
Hungarians
Costa Ricans
46.7%
ASSOCIATE'S DEGREE
59.3/ 100
METRIC RATING
166th/ 347
METRIC RANK
46.0%
ASSOCIATE'S DEGREE
38.6/ 100
METRIC RATING
185th/ 347
METRIC RANK
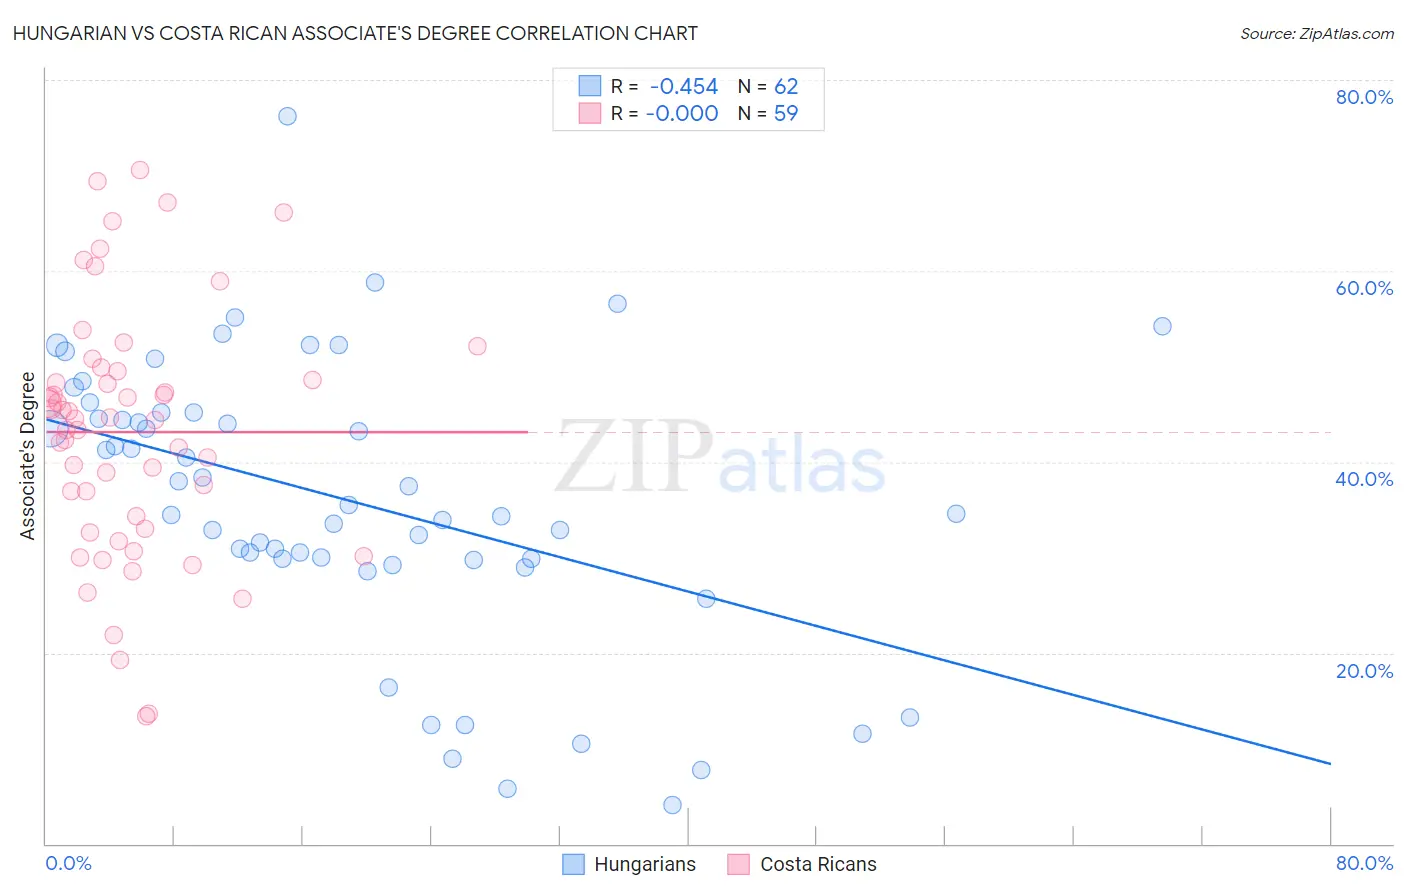
Hungarian vs Costa Rican Associate's Degree Correlation Chart
The statistical analysis conducted on geographies consisting of 486,216,105 people shows a moderate negative correlation between the proportion of Hungarians and percentage of population with at least associate's degree education in the United States with a correlation coefficient (R) of -0.454 and weighted average of 46.7%. Similarly, the statistical analysis conducted on geographies consisting of 253,596,799 people shows no correlation between the proportion of Costa Ricans and percentage of population with at least associate's degree education in the United States with a correlation coefficient (R) of -0.000 and weighted average of 46.0%, a difference of 1.6%.
Associate's Degree Correlation Summary
| Measurement | Hungarian | Costa Rican |
| Minimum | 4.0% | 13.4% |
| Maximum | 76.2% | 70.5% |
| Range | 72.2% | 57.2% |
| Mean | 35.9% | 43.1% |
| Median | 35.0% | 44.5% |
| Interquartile 25% (IQ1) | 29.9% | 33.0% |
| Interquartile 75% (IQ3) | 45.2% | 49.5% |
| Interquartile Range (IQR) | 15.3% | 16.5% |
| Standard Deviation (Sample) | 14.7% | 13.1% |
| Standard Deviation (Population) | 14.6% | 13.0% |
Demographics Similar to Hungarians and Costa Ricans by Associate's Degree
In terms of associate's degree, the demographic groups most similar to Hungarians are Immigrants from Sierra Leone (46.7%, a difference of 0.010%), Immigrants from South America (46.7%, a difference of 0.040%), Immigrants from Somalia (46.5%, a difference of 0.29%), Uruguayan (46.5%, a difference of 0.30%), and Irish (46.5%, a difference of 0.43%). Similarly, the demographic groups most similar to Costa Ricans are Czechoslovakian (46.0%, a difference of 0.11%), Yugoslavian (46.0%, a difference of 0.13%), Swiss (46.0%, a difference of 0.14%), Immigrants from Colombia (46.0%, a difference of 0.21%), and Bermudan (46.2%, a difference of 0.60%).
| Demographics | Rating | Rank | Associate's Degree |
| Immigrants | South America | 59.9 /100 | #165 | Average 46.7% |
| Hungarians | 59.3 /100 | #166 | Average 46.7% |
| Immigrants | Sierra Leone | 59.2 /100 | #167 | Average 46.7% |
| Immigrants | Somalia | 55.5 /100 | #168 | Average 46.5% |
| Uruguayans | 55.4 /100 | #169 | Average 46.5% |
| Irish | 53.6 /100 | #170 | Average 46.5% |
| Basques | 52.8 /100 | #171 | Average 46.5% |
| Peruvians | 50.5 /100 | #172 | Average 46.4% |
| Immigrants | Iraq | 50.3 /100 | #173 | Average 46.4% |
| English | 50.0 /100 | #174 | Average 46.4% |
| Belgians | 48.9 /100 | #175 | Average 46.3% |
| Finns | 48.5 /100 | #176 | Average 46.3% |
| Slovaks | 48.4 /100 | #177 | Average 46.3% |
| Immigrants | Bosnia and Herzegovina | 48.3 /100 | #178 | Average 46.3% |
| Sri Lankans | 47.6 /100 | #179 | Average 46.3% |
| Bermudans | 46.4 /100 | #180 | Average 46.2% |
| Immigrants | Colombia | 41.3 /100 | #181 | Average 46.0% |
| Swiss | 40.4 /100 | #182 | Average 46.0% |
| Yugoslavians | 40.2 /100 | #183 | Average 46.0% |
| Czechoslovakians | 40.0 /100 | #184 | Average 46.0% |
| Costa Ricans | 38.6 /100 | #185 | Fair 46.0% |