Hungarian vs Immigrants from Jamaica Median Household Income
COMPARE
Hungarian
Immigrants from Jamaica
Median Household Income
Median Household Income Comparison
Hungarians
Immigrants from Jamaica
$86,920
MEDIAN HOUSEHOLD INCOME
76.3/ 100
METRIC RATING
151st/ 347
METRIC RANK
$75,851
MEDIAN HOUSEHOLD INCOME
0.3/ 100
METRIC RATING
268th/ 347
METRIC RANK
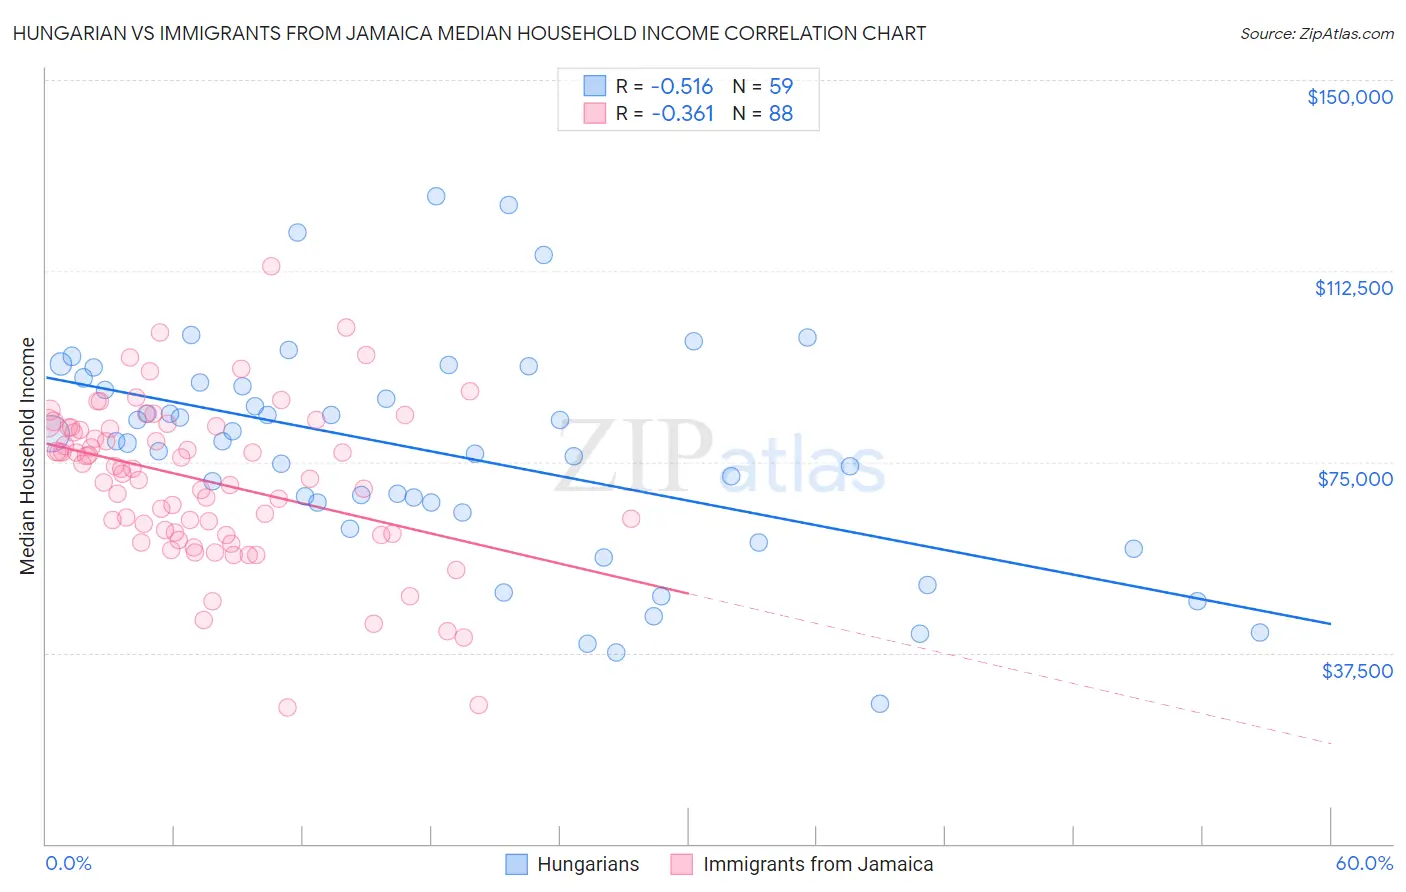
Hungarian vs Immigrants from Jamaica Median Household Income Correlation Chart
The statistical analysis conducted on geographies consisting of 485,741,386 people shows a substantial negative correlation between the proportion of Hungarians and median household income in the United States with a correlation coefficient (R) of -0.516 and weighted average of $86,920. Similarly, the statistical analysis conducted on geographies consisting of 301,517,769 people shows a mild negative correlation between the proportion of Immigrants from Jamaica and median household income in the United States with a correlation coefficient (R) of -0.361 and weighted average of $75,851, a difference of 14.6%.
Median Household Income Correlation Summary
| Measurement | Hungarian | Immigrants from Jamaica |
| Minimum | $27,488 | $26,823 |
| Maximum | $127,161 | $113,462 |
| Range | $99,673 | $86,639 |
| Mean | $76,828 | $71,387 |
| Median | $79,103 | $73,716 |
| Interquartile 25% (IQ1) | $65,060 | $60,983 |
| Interquartile 75% (IQ3) | $90,559 | $81,782 |
| Interquartile Range (IQR) | $25,499 | $20,798 |
| Standard Deviation (Sample) | $21,600 | $15,538 |
| Standard Deviation (Population) | $21,417 | $15,449 |
Similar Demographics by Median Household Income
Demographics Similar to Hungarians by Median Household Income
In terms of median household income, the demographic groups most similar to Hungarians are Immigrants from Saudi Arabia ($86,875, a difference of 0.050%), Basque ($87,001, a difference of 0.090%), South American ($86,824, a difference of 0.11%), Immigrants from Nepal ($87,046, a difference of 0.15%), and Immigrants from Germany ($86,764, a difference of 0.18%).
| Demographics | Rating | Rank | Median Household Income |
| Serbians | 83.0 /100 | #144 | Excellent $87,572 |
| Ugandans | 82.9 /100 | #145 | Excellent $87,557 |
| Immigrants | Uganda | 82.8 /100 | #146 | Excellent $87,553 |
| South American Indians | 81.8 /100 | #147 | Excellent $87,446 |
| Costa Ricans | 80.0 /100 | #148 | Excellent $87,262 |
| Immigrants | Nepal | 77.7 /100 | #149 | Good $87,046 |
| Basques | 77.2 /100 | #150 | Good $87,001 |
| Hungarians | 76.3 /100 | #151 | Good $86,920 |
| Immigrants | Saudi Arabia | 75.8 /100 | #152 | Good $86,875 |
| South Americans | 75.1 /100 | #153 | Good $86,824 |
| Immigrants | Germany | 74.4 /100 | #154 | Good $86,764 |
| Carpatho Rusyns | 72.8 /100 | #155 | Good $86,635 |
| Immigrants | Albania | 71.5 /100 | #156 | Good $86,534 |
| Samoans | 71.0 /100 | #157 | Good $86,498 |
| Moroccans | 70.6 /100 | #158 | Good $86,468 |
Demographics Similar to Immigrants from Jamaica by Median Household Income
In terms of median household income, the demographic groups most similar to Immigrants from Jamaica are Cape Verdean ($75,848, a difference of 0.0%), German Russian ($75,856, a difference of 0.010%), Hmong ($75,839, a difference of 0.020%), Pennsylvania German ($75,814, a difference of 0.050%), and Somali ($75,782, a difference of 0.090%).
| Demographics | Rating | Rank | Median Household Income |
| Immigrants | Grenada | 0.4 /100 | #261 | Tragic $76,517 |
| French American Indians | 0.4 /100 | #262 | Tragic $76,387 |
| Alaskan Athabascans | 0.4 /100 | #263 | Tragic $76,383 |
| Guatemalans | 0.3 /100 | #264 | Tragic $75,961 |
| Immigrants | Belize | 0.3 /100 | #265 | Tragic $75,938 |
| Americans | 0.3 /100 | #266 | Tragic $75,932 |
| German Russians | 0.3 /100 | #267 | Tragic $75,856 |
| Immigrants | Jamaica | 0.3 /100 | #268 | Tragic $75,851 |
| Cape Verdeans | 0.3 /100 | #269 | Tragic $75,848 |
| Hmong | 0.3 /100 | #270 | Tragic $75,839 |
| Pennsylvania Germans | 0.3 /100 | #271 | Tragic $75,814 |
| Somalis | 0.3 /100 | #272 | Tragic $75,782 |
| Liberians | 0.2 /100 | #273 | Tragic $75,667 |
| British West Indians | 0.2 /100 | #274 | Tragic $75,647 |
| Immigrants | Micronesia | 0.2 /100 | #275 | Tragic $75,574 |