Dutch vs Costa Rican Median Family Income
COMPARE
Dutch
Costa Rican
Median Family Income
Median Family Income Comparison
Dutch
Costa Ricans
$101,192
MEDIAN FAMILY INCOME
31.9/ 100
METRIC RATING
185th/ 347
METRIC RANK
$103,989
MEDIAN FAMILY INCOME
66.2/ 100
METRIC RATING
163rd/ 347
METRIC RANK
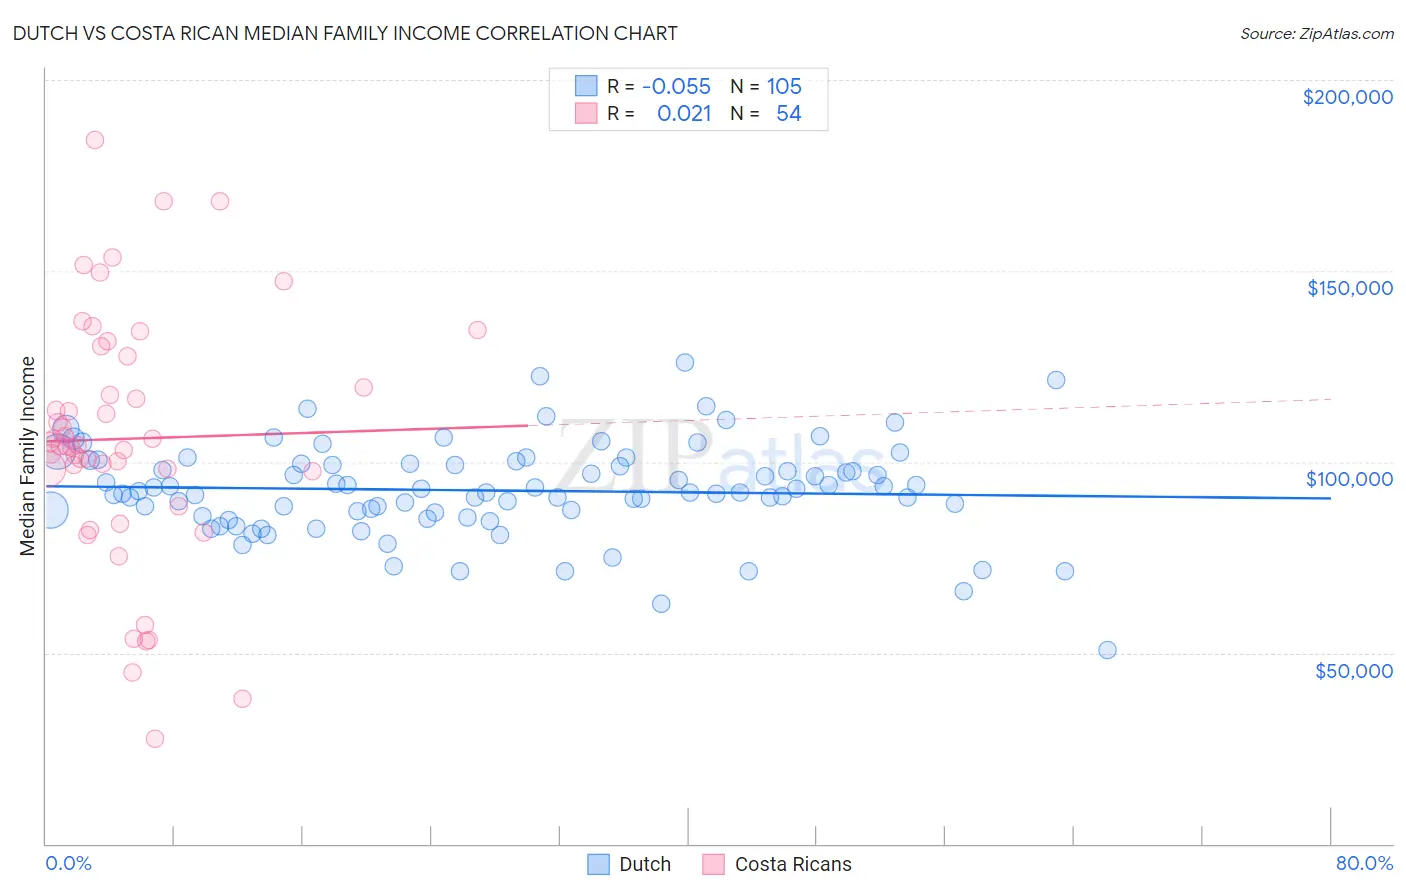
Dutch vs Costa Rican Median Family Income Correlation Chart
The statistical analysis conducted on geographies consisting of 553,300,632 people shows a slight negative correlation between the proportion of Dutch and median family income in the United States with a correlation coefficient (R) of -0.055 and weighted average of $101,192. Similarly, the statistical analysis conducted on geographies consisting of 253,398,040 people shows no correlation between the proportion of Costa Ricans and median family income in the United States with a correlation coefficient (R) of 0.021 and weighted average of $103,989, a difference of 2.8%.
Median Family Income Correlation Summary
| Measurement | Dutch | Costa Rican |
| Minimum | $50,679 | $27,614 |
| Maximum | $126,042 | $184,403 |
| Range | $75,363 | $156,789 |
| Mean | $92,505 | $106,057 |
| Median | $92,000 | $104,255 |
| Interquartile 25% (IQ1) | $86,239 | $97,569 |
| Interquartile 75% (IQ3) | $99,471 | $127,528 |
| Interquartile Range (IQR) | $13,232 | $29,959 |
| Standard Deviation (Sample) | $12,293 | $32,745 |
| Standard Deviation (Population) | $12,235 | $32,441 |
Similar Demographics by Median Family Income
Demographics Similar to Dutch by Median Family Income
In terms of median family income, the demographic groups most similar to Dutch are Celtic ($101,139, a difference of 0.050%), Tlingit-Haida ($101,092, a difference of 0.10%), Guamanian/Chamorro ($101,061, a difference of 0.13%), Immigrants from Costa Rica ($101,354, a difference of 0.16%), and Immigrants from Portugal ($100,984, a difference of 0.21%).
| Demographics | Rating | Rank | Median Family Income |
| Welsh | 43.3 /100 | #178 | Average $102,151 |
| South Americans | 39.7 /100 | #179 | Fair $101,856 |
| French Canadians | 37.0 /100 | #180 | Fair $101,634 |
| Spaniards | 36.8 /100 | #181 | Fair $101,617 |
| Tsimshian | 35.9 /100 | #182 | Fair $101,543 |
| Kenyans | 34.5 /100 | #183 | Fair $101,417 |
| Immigrants | Costa Rica | 33.7 /100 | #184 | Fair $101,354 |
| Dutch | 31.9 /100 | #185 | Fair $101,192 |
| Celtics | 31.3 /100 | #186 | Fair $101,139 |
| Tlingit-Haida | 30.8 /100 | #187 | Fair $101,092 |
| Guamanians/Chamorros | 30.5 /100 | #188 | Fair $101,061 |
| Immigrants | Portugal | 29.6 /100 | #189 | Fair $100,984 |
| Immigrants | Immigrants | 29.4 /100 | #190 | Fair $100,962 |
| Colombians | 27.2 /100 | #191 | Fair $100,750 |
| Immigrants | Kenya | 26.5 /100 | #192 | Fair $100,679 |
Demographics Similar to Costa Ricans by Median Family Income
In terms of median family income, the demographic groups most similar to Costa Ricans are Immigrants from Sierra Leone ($103,990, a difference of 0.0%), Sierra Leonean ($103,859, a difference of 0.13%), Slovak ($103,729, a difference of 0.25%), Icelander ($104,282, a difference of 0.28%), and Scottish ($104,288, a difference of 0.29%).
| Demographics | Rating | Rank | Median Family Income |
| Basques | 74.4 /100 | #156 | Good $104,760 |
| Moroccans | 71.6 /100 | #157 | Good $104,488 |
| Scandinavians | 70.8 /100 | #158 | Good $104,410 |
| Swiss | 70.7 /100 | #159 | Good $104,396 |
| Scottish | 69.5 /100 | #160 | Good $104,288 |
| Icelanders | 69.4 /100 | #161 | Good $104,282 |
| Immigrants | Sierra Leone | 66.2 /100 | #162 | Good $103,990 |
| Costa Ricans | 66.2 /100 | #163 | Good $103,989 |
| Sierra Leoneans | 64.7 /100 | #164 | Good $103,859 |
| Slovaks | 63.1 /100 | #165 | Good $103,729 |
| English | 62.6 /100 | #166 | Good $103,684 |
| South American Indians | 61.9 /100 | #167 | Good $103,624 |
| Immigrants | Peru | 60.8 /100 | #168 | Good $103,534 |
| Czechoslovakians | 57.6 /100 | #169 | Average $103,273 |
| Immigrants | Uzbekistan | 56.6 /100 | #170 | Average $103,197 |