Slovene vs Costa Rican Median Family Income
COMPARE
Slovene
Costa Rican
Median Family Income
Median Family Income Comparison
Slovenes
Costa Ricans
$106,020
MEDIAN FAMILY INCOME
84.7/ 100
METRIC RATING
142nd/ 347
METRIC RANK
$103,989
MEDIAN FAMILY INCOME
66.2/ 100
METRIC RATING
163rd/ 347
METRIC RANK
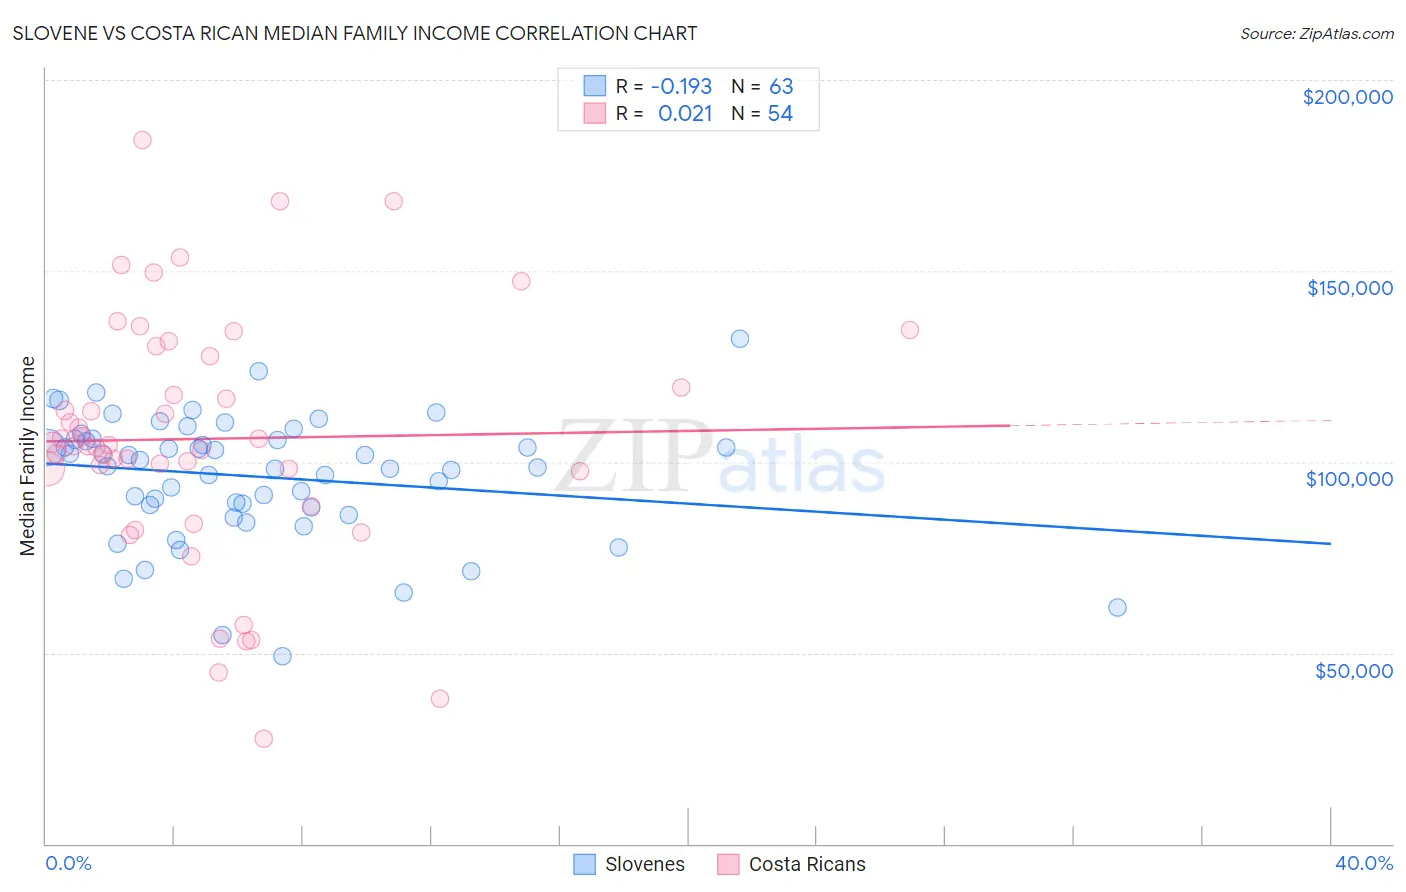
Slovene vs Costa Rican Median Family Income Correlation Chart
The statistical analysis conducted on geographies consisting of 261,214,906 people shows a poor negative correlation between the proportion of Slovenes and median family income in the United States with a correlation coefficient (R) of -0.193 and weighted average of $106,020. Similarly, the statistical analysis conducted on geographies consisting of 253,398,040 people shows no correlation between the proportion of Costa Ricans and median family income in the United States with a correlation coefficient (R) of 0.021 and weighted average of $103,989, a difference of 1.9%.
Median Family Income Correlation Summary
| Measurement | Slovene | Costa Rican |
| Minimum | $48,984 | $27,614 |
| Maximum | $132,096 | $184,403 |
| Range | $83,112 | $156,789 |
| Mean | $96,087 | $106,057 |
| Median | $98,910 | $104,255 |
| Interquartile 25% (IQ1) | $88,135 | $97,569 |
| Interquartile 75% (IQ3) | $105,910 | $127,528 |
| Interquartile Range (IQR) | $17,775 | $29,959 |
| Standard Deviation (Sample) | $16,283 | $32,745 |
| Standard Deviation (Population) | $16,153 | $32,441 |
Similar Demographics by Median Family Income
Demographics Similar to Slovenes by Median Family Income
In terms of median family income, the demographic groups most similar to Slovenes are Tongan ($105,967, a difference of 0.050%), Immigrants from Morocco ($105,964, a difference of 0.050%), Immigrants from Syria ($106,118, a difference of 0.090%), Danish ($105,900, a difference of 0.11%), and Norwegian ($106,144, a difference of 0.12%).
| Demographics | Rating | Rank | Median Family Income |
| Portuguese | 86.3 /100 | #135 | Excellent $106,286 |
| Immigrants | South Eastern Asia | 86.1 /100 | #136 | Excellent $106,252 |
| Immigrants | Uganda | 85.7 /100 | #137 | Excellent $106,188 |
| Immigrants | Vietnam | 85.7 /100 | #138 | Excellent $106,186 |
| Luxembourgers | 85.7 /100 | #139 | Excellent $106,183 |
| Norwegians | 85.5 /100 | #140 | Excellent $106,144 |
| Immigrants | Syria | 85.3 /100 | #141 | Excellent $106,118 |
| Slovenes | 84.7 /100 | #142 | Excellent $106,020 |
| Tongans | 84.3 /100 | #143 | Excellent $105,967 |
| Immigrants | Morocco | 84.3 /100 | #144 | Excellent $105,964 |
| Danes | 83.8 /100 | #145 | Excellent $105,900 |
| Czechs | 83.4 /100 | #146 | Excellent $105,839 |
| Immigrants | Chile | 82.1 /100 | #147 | Excellent $105,655 |
| Hungarians | 81.7 /100 | #148 | Excellent $105,609 |
| Immigrants | Germany | 80.9 /100 | #149 | Excellent $105,507 |
Demographics Similar to Costa Ricans by Median Family Income
In terms of median family income, the demographic groups most similar to Costa Ricans are Immigrants from Sierra Leone ($103,990, a difference of 0.0%), Sierra Leonean ($103,859, a difference of 0.13%), Slovak ($103,729, a difference of 0.25%), Icelander ($104,282, a difference of 0.28%), and Scottish ($104,288, a difference of 0.29%).
| Demographics | Rating | Rank | Median Family Income |
| Basques | 74.4 /100 | #156 | Good $104,760 |
| Moroccans | 71.6 /100 | #157 | Good $104,488 |
| Scandinavians | 70.8 /100 | #158 | Good $104,410 |
| Swiss | 70.7 /100 | #159 | Good $104,396 |
| Scottish | 69.5 /100 | #160 | Good $104,288 |
| Icelanders | 69.4 /100 | #161 | Good $104,282 |
| Immigrants | Sierra Leone | 66.2 /100 | #162 | Good $103,990 |
| Costa Ricans | 66.2 /100 | #163 | Good $103,989 |
| Sierra Leoneans | 64.7 /100 | #164 | Good $103,859 |
| Slovaks | 63.1 /100 | #165 | Good $103,729 |
| English | 62.6 /100 | #166 | Good $103,684 |
| South American Indians | 61.9 /100 | #167 | Good $103,624 |
| Immigrants | Peru | 60.8 /100 | #168 | Good $103,534 |
| Czechoslovakians | 57.6 /100 | #169 | Average $103,273 |
| Immigrants | Uzbekistan | 56.6 /100 | #170 | Average $103,197 |