Immigrants from Eritrea vs Costa Rican Median Family Income
COMPARE
Immigrants from Eritrea
Costa Rican
Median Family Income
Median Family Income Comparison
Immigrants from Eritrea
Costa Ricans
$102,823
MEDIAN FAMILY INCOME
51.9/ 100
METRIC RATING
172nd/ 347
METRIC RANK
$103,989
MEDIAN FAMILY INCOME
66.2/ 100
METRIC RATING
163rd/ 347
METRIC RANK
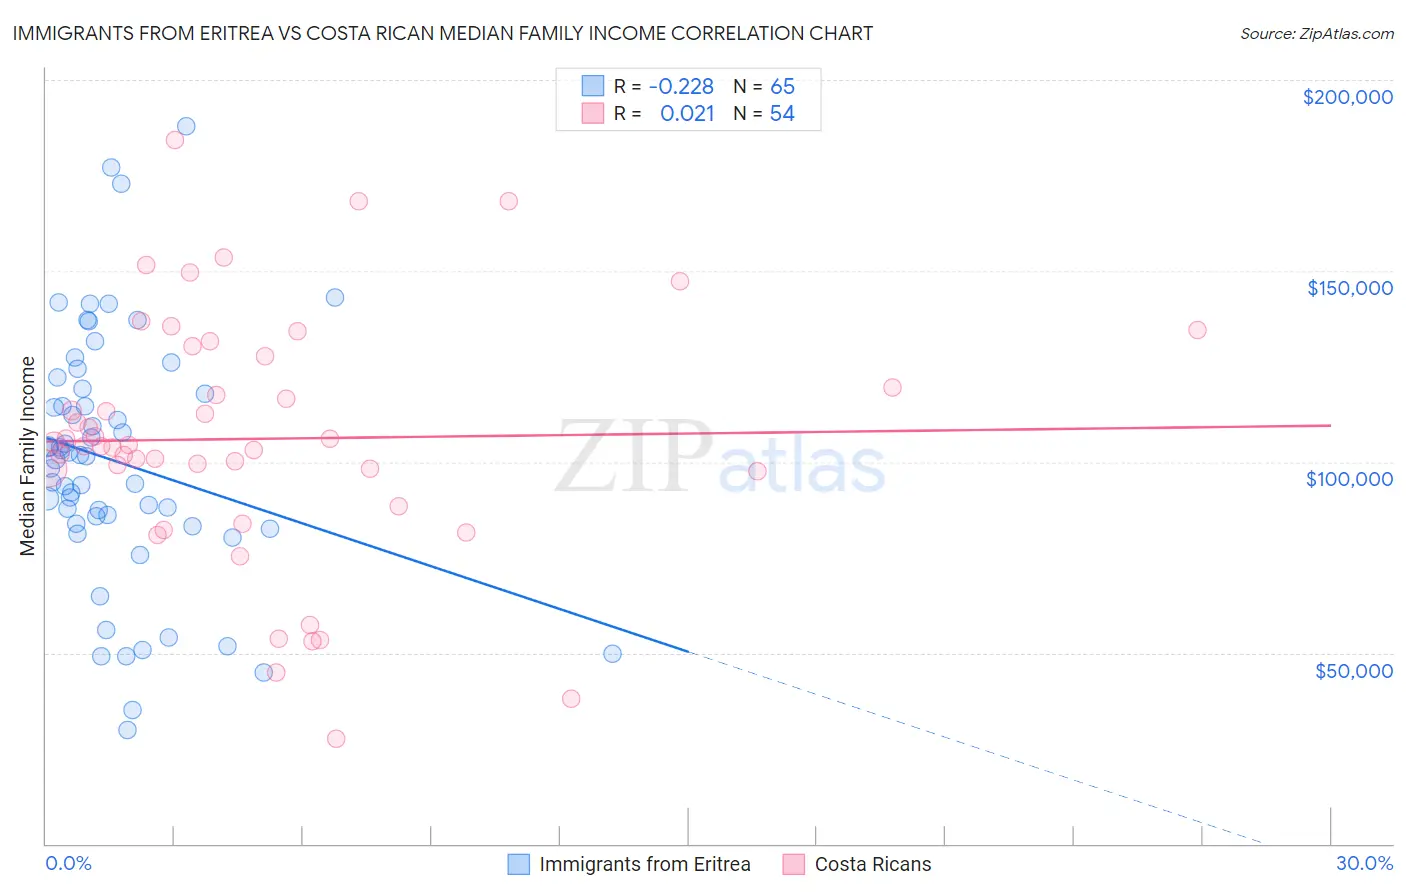
Immigrants from Eritrea vs Costa Rican Median Family Income Correlation Chart
The statistical analysis conducted on geographies consisting of 104,842,839 people shows a weak negative correlation between the proportion of Immigrants from Eritrea and median family income in the United States with a correlation coefficient (R) of -0.228 and weighted average of $102,823. Similarly, the statistical analysis conducted on geographies consisting of 253,398,040 people shows no correlation between the proportion of Costa Ricans and median family income in the United States with a correlation coefficient (R) of 0.021 and weighted average of $103,989, a difference of 1.1%.
Median Family Income Correlation Summary
| Measurement | Immigrants from Eritrea | Costa Rican |
| Minimum | $29,777 | $27,614 |
| Maximum | $188,047 | $184,403 |
| Range | $158,270 | $156,789 |
| Mean | $99,919 | $106,057 |
| Median | $101,536 | $104,255 |
| Interquartile 25% (IQ1) | $83,487 | $97,569 |
| Interquartile 75% (IQ3) | $118,485 | $127,528 |
| Interquartile Range (IQR) | $34,998 | $29,959 |
| Standard Deviation (Sample) | $32,848 | $32,745 |
| Standard Deviation (Population) | $32,595 | $32,441 |
Demographics Similar to Immigrants from Eritrea and Costa Ricans by Median Family Income
In terms of median family income, the demographic groups most similar to Immigrants from Eritrea are Belgian ($102,788, a difference of 0.030%), Finnish ($102,676, a difference of 0.14%), Alsatian ($103,010, a difference of 0.18%), Immigrants from Uzbekistan ($103,197, a difference of 0.36%), and Immigrants from Eastern Africa ($102,451, a difference of 0.36%). Similarly, the demographic groups most similar to Costa Ricans are Immigrants from Sierra Leone ($103,990, a difference of 0.0%), Sierra Leonean ($103,859, a difference of 0.13%), Slovak ($103,729, a difference of 0.25%), Icelander ($104,282, a difference of 0.28%), and Scottish ($104,288, a difference of 0.29%).
| Demographics | Rating | Rank | Median Family Income |
| Moroccans | 71.6 /100 | #157 | Good $104,488 |
| Scandinavians | 70.8 /100 | #158 | Good $104,410 |
| Swiss | 70.7 /100 | #159 | Good $104,396 |
| Scottish | 69.5 /100 | #160 | Good $104,288 |
| Icelanders | 69.4 /100 | #161 | Good $104,282 |
| Immigrants | Sierra Leone | 66.2 /100 | #162 | Good $103,990 |
| Costa Ricans | 66.2 /100 | #163 | Good $103,989 |
| Sierra Leoneans | 64.7 /100 | #164 | Good $103,859 |
| Slovaks | 63.1 /100 | #165 | Good $103,729 |
| English | 62.6 /100 | #166 | Good $103,684 |
| South American Indians | 61.9 /100 | #167 | Good $103,624 |
| Immigrants | Peru | 60.8 /100 | #168 | Good $103,534 |
| Czechoslovakians | 57.6 /100 | #169 | Average $103,273 |
| Immigrants | Uzbekistan | 56.6 /100 | #170 | Average $103,197 |
| Alsatians | 54.3 /100 | #171 | Average $103,010 |
| Immigrants | Eritrea | 51.9 /100 | #172 | Average $102,823 |
| Belgians | 51.4 /100 | #173 | Average $102,788 |
| Finns | 50.0 /100 | #174 | Average $102,676 |
| Immigrants | Eastern Africa | 47.1 /100 | #175 | Average $102,451 |
| French | 46.1 /100 | #176 | Average $102,368 |
| Germans | 44.6 /100 | #177 | Average $102,254 |