Immigrants from Bangladesh vs Costa Rican Median Family Income
COMPARE
Immigrants from Bangladesh
Costa Rican
Median Family Income
Median Family Income Comparison
Immigrants from Bangladesh
Costa Ricans
$94,665
MEDIAN FAMILY INCOME
1.6/ 100
METRIC RATING
233rd/ 347
METRIC RANK
$103,989
MEDIAN FAMILY INCOME
66.2/ 100
METRIC RATING
163rd/ 347
METRIC RANK
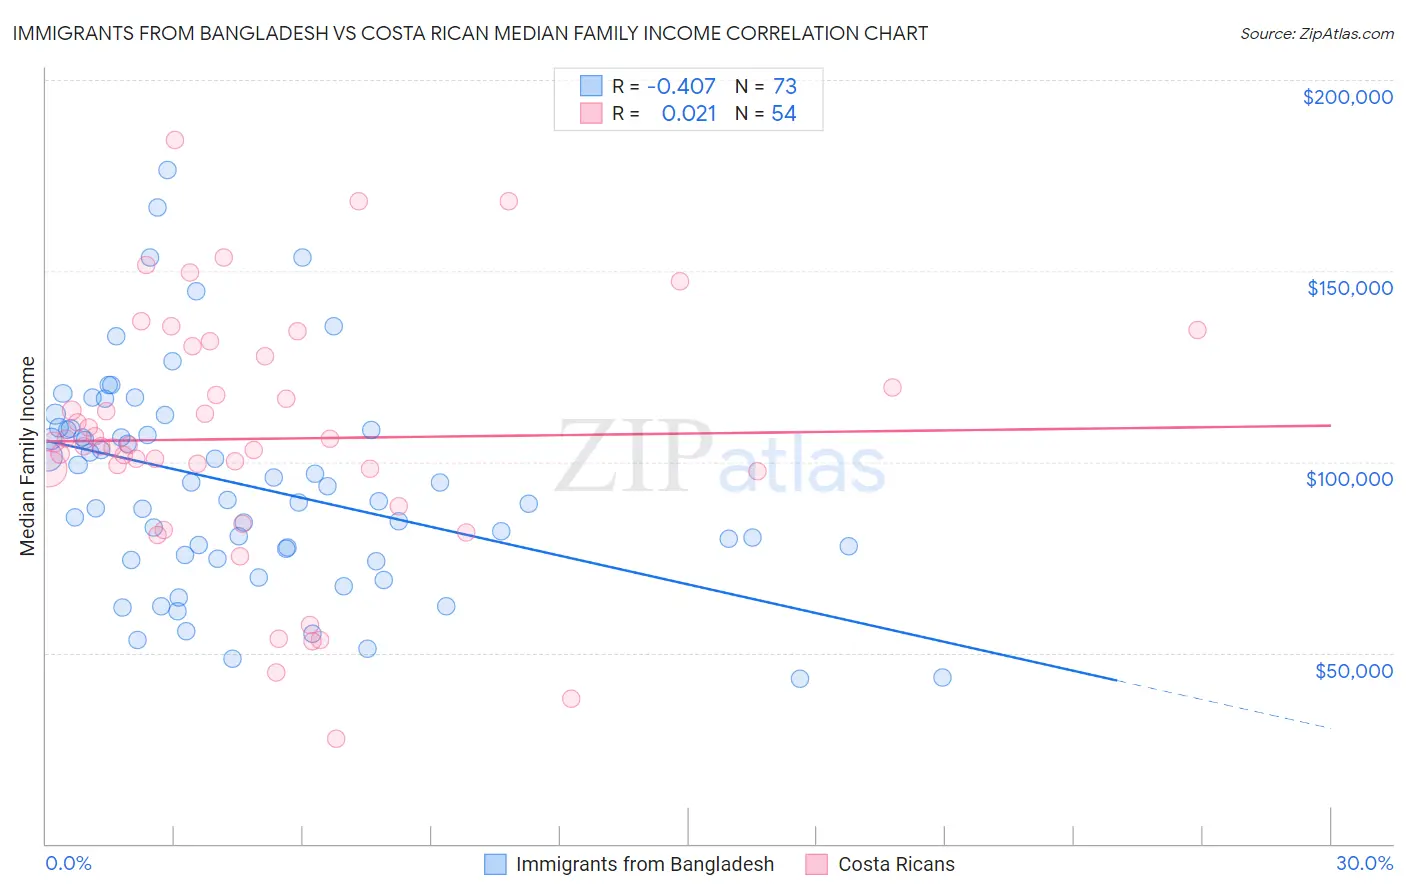
Immigrants from Bangladesh vs Costa Rican Median Family Income Correlation Chart
The statistical analysis conducted on geographies consisting of 203,503,484 people shows a moderate negative correlation between the proportion of Immigrants from Bangladesh and median family income in the United States with a correlation coefficient (R) of -0.407 and weighted average of $94,665. Similarly, the statistical analysis conducted on geographies consisting of 253,398,040 people shows no correlation between the proportion of Costa Ricans and median family income in the United States with a correlation coefficient (R) of 0.021 and weighted average of $103,989, a difference of 9.9%.
Median Family Income Correlation Summary
| Measurement | Immigrants from Bangladesh | Costa Rican |
| Minimum | $43,315 | $27,614 |
| Maximum | $176,322 | $184,403 |
| Range | $133,007 | $156,789 |
| Mean | $93,798 | $106,057 |
| Median | $90,050 | $104,255 |
| Interquartile 25% (IQ1) | $75,060 | $97,569 |
| Interquartile 75% (IQ3) | $108,612 | $127,528 |
| Interquartile Range (IQR) | $33,553 | $29,959 |
| Standard Deviation (Sample) | $28,054 | $32,745 |
| Standard Deviation (Population) | $27,861 | $32,441 |
Similar Demographics by Median Family Income
Demographics Similar to Immigrants from Bangladesh by Median Family Income
In terms of median family income, the demographic groups most similar to Immigrants from Bangladesh are Immigrants from Western Africa ($94,638, a difference of 0.030%), Immigrants from Burma/Myanmar ($94,472, a difference of 0.20%), Trinidadian and Tobagonian ($94,466, a difference of 0.21%), Immigrants from Venezuela ($94,904, a difference of 0.25%), and Alaskan Athabascan ($94,429, a difference of 0.25%).
| Demographics | Rating | Rank | Median Family Income |
| Immigrants | Panama | 2.7 /100 | #226 | Tragic $95,647 |
| Alaska Natives | 2.6 /100 | #227 | Tragic $95,573 |
| Immigrants | Azores | 2.4 /100 | #228 | Tragic $95,402 |
| Marshallese | 2.2 /100 | #229 | Tragic $95,293 |
| Malaysians | 2.2 /100 | #230 | Tragic $95,230 |
| Ecuadorians | 2.1 /100 | #231 | Tragic $95,114 |
| Immigrants | Venezuela | 1.9 /100 | #232 | Tragic $94,904 |
| Immigrants | Bangladesh | 1.6 /100 | #233 | Tragic $94,665 |
| Immigrants | Western Africa | 1.6 /100 | #234 | Tragic $94,638 |
| Immigrants | Burma/Myanmar | 1.5 /100 | #235 | Tragic $94,472 |
| Trinidadians and Tobagonians | 1.5 /100 | #236 | Tragic $94,466 |
| Alaskan Athabascans | 1.5 /100 | #237 | Tragic $94,429 |
| Nepalese | 1.3 /100 | #238 | Tragic $94,153 |
| Salvadorans | 1.2 /100 | #239 | Tragic $94,109 |
| Somalis | 1.2 /100 | #240 | Tragic $94,085 |
Demographics Similar to Costa Ricans by Median Family Income
In terms of median family income, the demographic groups most similar to Costa Ricans are Immigrants from Sierra Leone ($103,990, a difference of 0.0%), Sierra Leonean ($103,859, a difference of 0.13%), Slovak ($103,729, a difference of 0.25%), Icelander ($104,282, a difference of 0.28%), and Scottish ($104,288, a difference of 0.29%).
| Demographics | Rating | Rank | Median Family Income |
| Basques | 74.4 /100 | #156 | Good $104,760 |
| Moroccans | 71.6 /100 | #157 | Good $104,488 |
| Scandinavians | 70.8 /100 | #158 | Good $104,410 |
| Swiss | 70.7 /100 | #159 | Good $104,396 |
| Scottish | 69.5 /100 | #160 | Good $104,288 |
| Icelanders | 69.4 /100 | #161 | Good $104,282 |
| Immigrants | Sierra Leone | 66.2 /100 | #162 | Good $103,990 |
| Costa Ricans | 66.2 /100 | #163 | Good $103,989 |
| Sierra Leoneans | 64.7 /100 | #164 | Good $103,859 |
| Slovaks | 63.1 /100 | #165 | Good $103,729 |
| English | 62.6 /100 | #166 | Good $103,684 |
| South American Indians | 61.9 /100 | #167 | Good $103,624 |
| Immigrants | Peru | 60.8 /100 | #168 | Good $103,534 |
| Czechoslovakians | 57.6 /100 | #169 | Average $103,273 |
| Immigrants | Uzbekistan | 56.6 /100 | #170 | Average $103,197 |