Houma vs Yup'ik In Labor Force | Age 25-29
COMPARE
Houma
Yup'ik
In Labor Force | Age 25-29
In Labor Force | Age 25-29 Comparison
Houma
Yup'ik
81.2%
IN LABOR FORCE | AGE 25-29
0.0/ 100
METRIC RATING
324th/ 347
METRIC RANK
73.1%
IN LABOR FORCE | AGE 25-29
0.0/ 100
METRIC RATING
347th/ 347
METRIC RANK
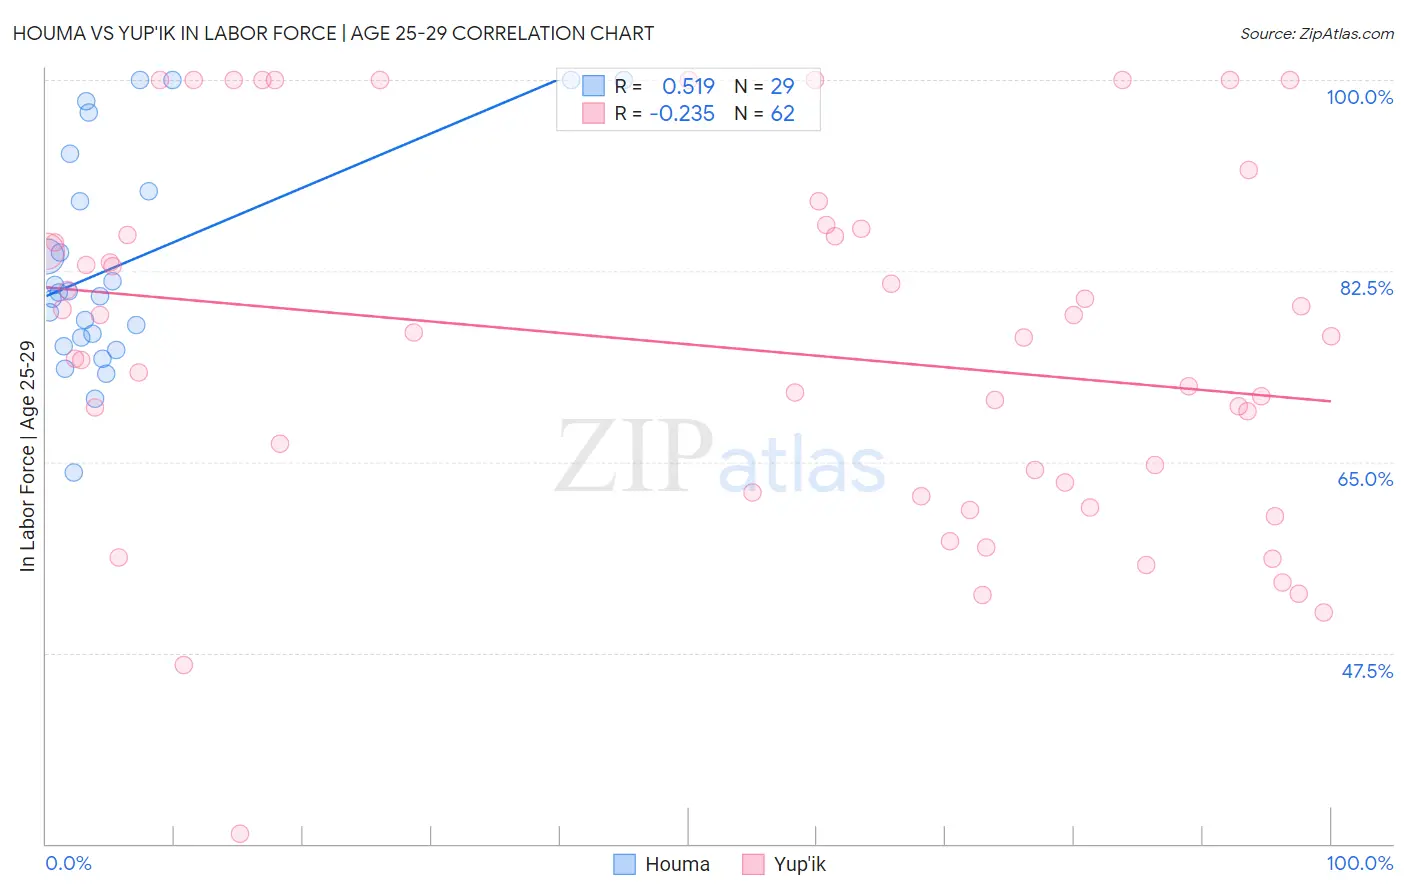
Houma vs Yup'ik In Labor Force | Age 25-29 Correlation Chart
The statistical analysis conducted on geographies consisting of 36,788,935 people shows a substantial positive correlation between the proportion of Houma and labor force participation rate among population between the ages 25 and 29 in the United States with a correlation coefficient (R) of 0.519 and weighted average of 81.2%. Similarly, the statistical analysis conducted on geographies consisting of 39,957,575 people shows a weak negative correlation between the proportion of Yup'ik and labor force participation rate among population between the ages 25 and 29 in the United States with a correlation coefficient (R) of -0.235 and weighted average of 73.1%, a difference of 11.2%.
In Labor Force | Age 25-29 Correlation Summary
| Measurement | Houma | Yup'ik |
| Minimum | 64.0% | 30.9% |
| Maximum | 100.0% | 100.0% |
| Range | 36.0% | 69.1% |
| Mean | 83.2% | 75.5% |
| Median | 80.5% | 76.4% |
| Interquartile 25% (IQ1) | 76.0% | 62.2% |
| Interquartile 75% (IQ3) | 91.5% | 85.8% |
| Interquartile Range (IQR) | 15.5% | 23.6% |
| Standard Deviation (Sample) | 10.1% | 16.4% |
| Standard Deviation (Population) | 9.9% | 16.3% |
Similar Demographics by In Labor Force | Age 25-29
Demographics Similar to Houma by In Labor Force | Age 25-29
In terms of in labor force | age 25-29, the demographic groups most similar to Houma are Dutch West Indian (81.1%, a difference of 0.11%), Choctaw (81.0%, a difference of 0.32%), Alaska Native (81.6%, a difference of 0.41%), Kiowa (81.6%, a difference of 0.45%), and Shoshone (81.6%, a difference of 0.46%).
| Demographics | Rating | Rank | In Labor Force | Age 25-29 |
| Chickasaw | 0.0 /100 | #317 | Tragic 81.9% |
| Comanche | 0.0 /100 | #318 | Tragic 81.9% |
| Seminole | 0.0 /100 | #319 | Tragic 81.7% |
| Colville | 0.0 /100 | #320 | Tragic 81.6% |
| Shoshone | 0.0 /100 | #321 | Tragic 81.6% |
| Kiowa | 0.0 /100 | #322 | Tragic 81.6% |
| Alaska Natives | 0.0 /100 | #323 | Tragic 81.6% |
| Houma | 0.0 /100 | #324 | Tragic 81.2% |
| Dutch West Indians | 0.0 /100 | #325 | Tragic 81.1% |
| Choctaw | 0.0 /100 | #326 | Tragic 81.0% |
| Ute | 0.0 /100 | #327 | Tragic 80.8% |
| Creek | 0.0 /100 | #328 | Tragic 80.7% |
| Yakama | 0.0 /100 | #329 | Tragic 80.6% |
| Puerto Ricans | 0.0 /100 | #330 | Tragic 80.4% |
| Cheyenne | 0.0 /100 | #331 | Tragic 80.3% |
Demographics Similar to Yup'ik by In Labor Force | Age 25-29
In terms of in labor force | age 25-29, the demographic groups most similar to Yup'ik are Pima (74.3%, a difference of 1.7%), Navajo (74.6%, a difference of 2.2%), Hopi (76.5%, a difference of 4.8%), Arapaho (76.6%, a difference of 4.8%), and Pueblo (77.5%, a difference of 6.1%).
| Demographics | Rating | Rank | In Labor Force | Age 25-29 |
| Sioux | 0.0 /100 | #333 | Tragic 79.7% |
| Yuman | 0.0 /100 | #334 | Tragic 79.3% |
| Natives/Alaskans | 0.0 /100 | #335 | Tragic 79.3% |
| Apache | 0.0 /100 | #336 | Tragic 79.2% |
| Crow | 0.0 /100 | #337 | Tragic 78.6% |
| Lumbee | 0.0 /100 | #338 | Tragic 78.3% |
| Immigrants | Yemen | 0.0 /100 | #339 | Tragic 78.2% |
| Paiute | 0.0 /100 | #340 | Tragic 78.1% |
| Tohono O'odham | 0.0 /100 | #341 | Tragic 77.5% |
| Pueblo | 0.0 /100 | #342 | Tragic 77.5% |
| Arapaho | 0.0 /100 | #343 | Tragic 76.6% |
| Hopi | 0.0 /100 | #344 | Tragic 76.5% |
| Navajo | 0.0 /100 | #345 | Tragic 74.6% |
| Pima | 0.0 /100 | #346 | Tragic 74.3% |
| Yup'ik | 0.0 /100 | #347 | Tragic 73.1% |