Honduran vs South American Median Female Earnings
COMPARE
Honduran
South American
Median Female Earnings
Median Female Earnings Comparison
Hondurans
South Americans
$35,013
MEDIAN FEMALE EARNINGS
0.0/ 100
METRIC RATING
309th/ 347
METRIC RANK
$39,698
MEDIAN FEMALE EARNINGS
50.0/ 100
METRIC RATING
174th/ 347
METRIC RANK
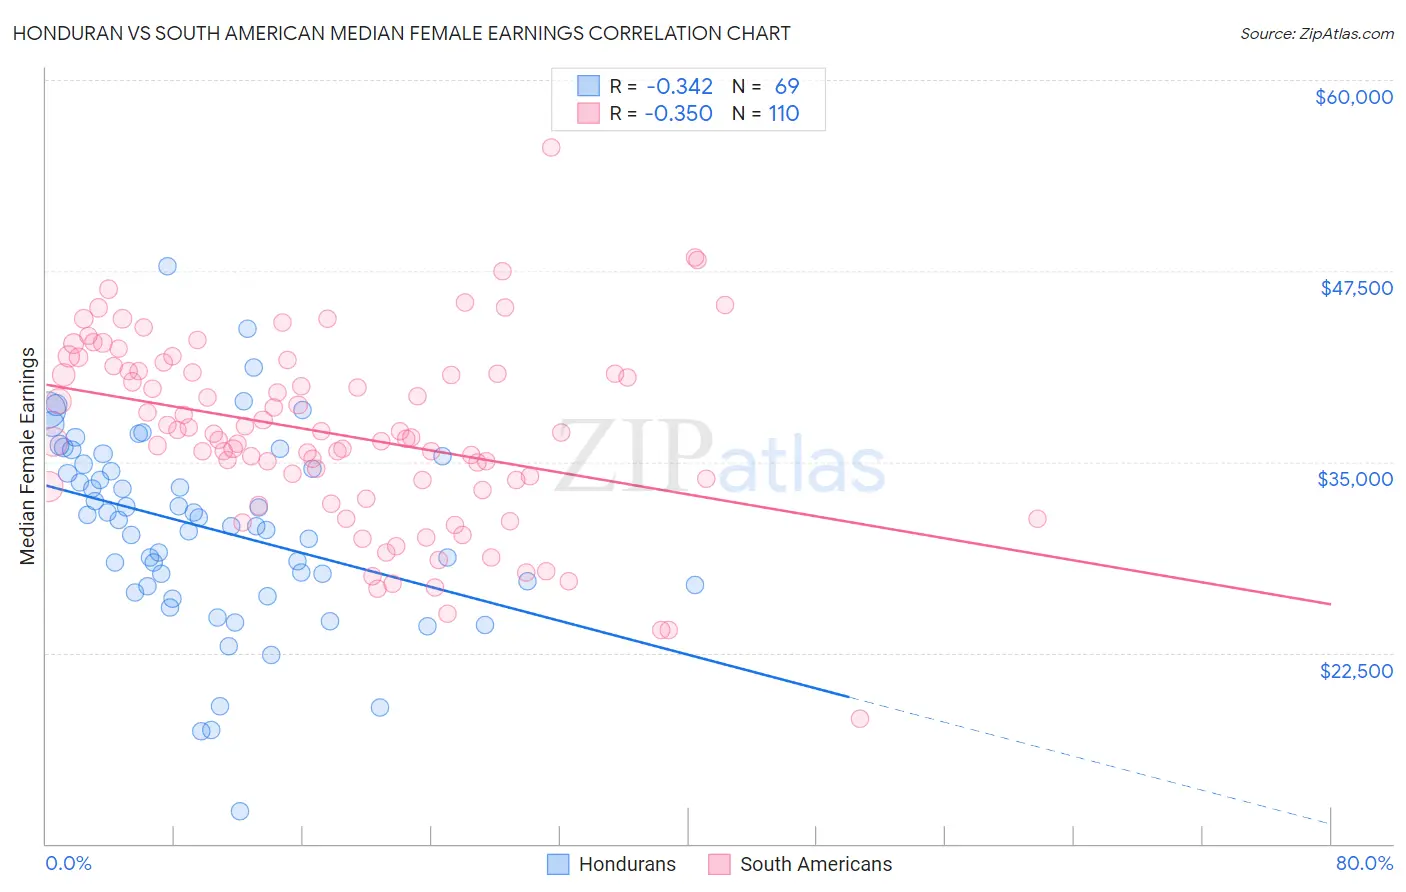
Honduran vs South American Median Female Earnings Correlation Chart
The statistical analysis conducted on geographies consisting of 357,702,253 people shows a mild negative correlation between the proportion of Hondurans and median female earnings in the United States with a correlation coefficient (R) of -0.342 and weighted average of $35,013. Similarly, the statistical analysis conducted on geographies consisting of 493,793,554 people shows a mild negative correlation between the proportion of South Americans and median female earnings in the United States with a correlation coefficient (R) of -0.350 and weighted average of $39,698, a difference of 13.4%.
Median Female Earnings Correlation Summary
| Measurement | Honduran | South American |
| Minimum | $12,102 | $18,150 |
| Maximum | $47,798 | $55,607 |
| Range | $35,696 | $37,457 |
| Mean | $30,670 | $36,804 |
| Median | $31,162 | $36,715 |
| Interquartile 25% (IQ1) | $26,901 | $33,376 |
| Interquartile 75% (IQ3) | $35,123 | $40,920 |
| Interquartile Range (IQR) | $8,221 | $7,545 |
| Standard Deviation (Sample) | $6,330 | $6,134 |
| Standard Deviation (Population) | $6,284 | $6,106 |
Similar Demographics by Median Female Earnings
Demographics Similar to Hondurans by Median Female Earnings
In terms of median female earnings, the demographic groups most similar to Hondurans are Chippewa ($35,003, a difference of 0.030%), Immigrants from Bahamas ($35,027, a difference of 0.040%), Sioux ($35,063, a difference of 0.14%), Ute ($34,960, a difference of 0.15%), and Yaqui ($34,943, a difference of 0.20%).
| Demographics | Rating | Rank | Median Female Earnings |
| Blacks/African Americans | 0.0 /100 | #302 | Tragic $35,315 |
| Immigrants | Latin America | 0.0 /100 | #303 | Tragic $35,307 |
| Crow | 0.0 /100 | #304 | Tragic $35,266 |
| Bahamians | 0.0 /100 | #305 | Tragic $35,125 |
| Fijians | 0.0 /100 | #306 | Tragic $35,114 |
| Sioux | 0.0 /100 | #307 | Tragic $35,063 |
| Immigrants | Bahamas | 0.0 /100 | #308 | Tragic $35,027 |
| Hondurans | 0.0 /100 | #309 | Tragic $35,013 |
| Chippewa | 0.0 /100 | #310 | Tragic $35,003 |
| Ute | 0.0 /100 | #311 | Tragic $34,960 |
| Yaqui | 0.0 /100 | #312 | Tragic $34,943 |
| Cubans | 0.0 /100 | #313 | Tragic $34,942 |
| Apache | 0.0 /100 | #314 | Tragic $34,895 |
| Pennsylvania Germans | 0.0 /100 | #315 | Tragic $34,802 |
| Cherokee | 0.0 /100 | #316 | Tragic $34,742 |
Demographics Similar to South Americans by Median Female Earnings
In terms of median female earnings, the demographic groups most similar to South Americans are Canadian ($39,724, a difference of 0.070%), Immigrants from South America ($39,643, a difference of 0.14%), Nigerian ($39,641, a difference of 0.14%), British ($39,772, a difference of 0.19%), and Costa Rican ($39,622, a difference of 0.19%).
| Demographics | Rating | Rank | Median Female Earnings |
| Luxembourgers | 59.9 /100 | #167 | Average $39,891 |
| Immigrants | Peru | 58.9 /100 | #168 | Average $39,871 |
| Kenyans | 58.4 /100 | #169 | Average $39,860 |
| Slovenes | 56.2 /100 | #170 | Average $39,817 |
| Immigrants | Portugal | 54.7 /100 | #171 | Average $39,788 |
| British | 53.8 /100 | #172 | Average $39,772 |
| Canadians | 51.4 /100 | #173 | Average $39,724 |
| South Americans | 50.0 /100 | #174 | Average $39,698 |
| Immigrants | South America | 47.2 /100 | #175 | Average $39,643 |
| Nigerians | 47.0 /100 | #176 | Average $39,641 |
| Costa Ricans | 46.1 /100 | #177 | Average $39,622 |
| Slavs | 45.6 /100 | #178 | Average $39,613 |
| Immigrants | Germany | 45.1 /100 | #179 | Average $39,603 |
| Immigrants | Kenya | 41.6 /100 | #180 | Average $39,535 |
| Tsimshian | 41.4 /100 | #181 | Average $39,530 |