Honduran vs Immigrants from Honduras Median Female Earnings
COMPARE
Honduran
Immigrants from Honduras
Median Female Earnings
Median Female Earnings Comparison
Hondurans
Immigrants from Honduras
$35,013
MEDIAN FEMALE EARNINGS
0.0/ 100
METRIC RATING
309th/ 347
METRIC RANK
$34,647
MEDIAN FEMALE EARNINGS
0.0/ 100
METRIC RATING
320th/ 347
METRIC RANK
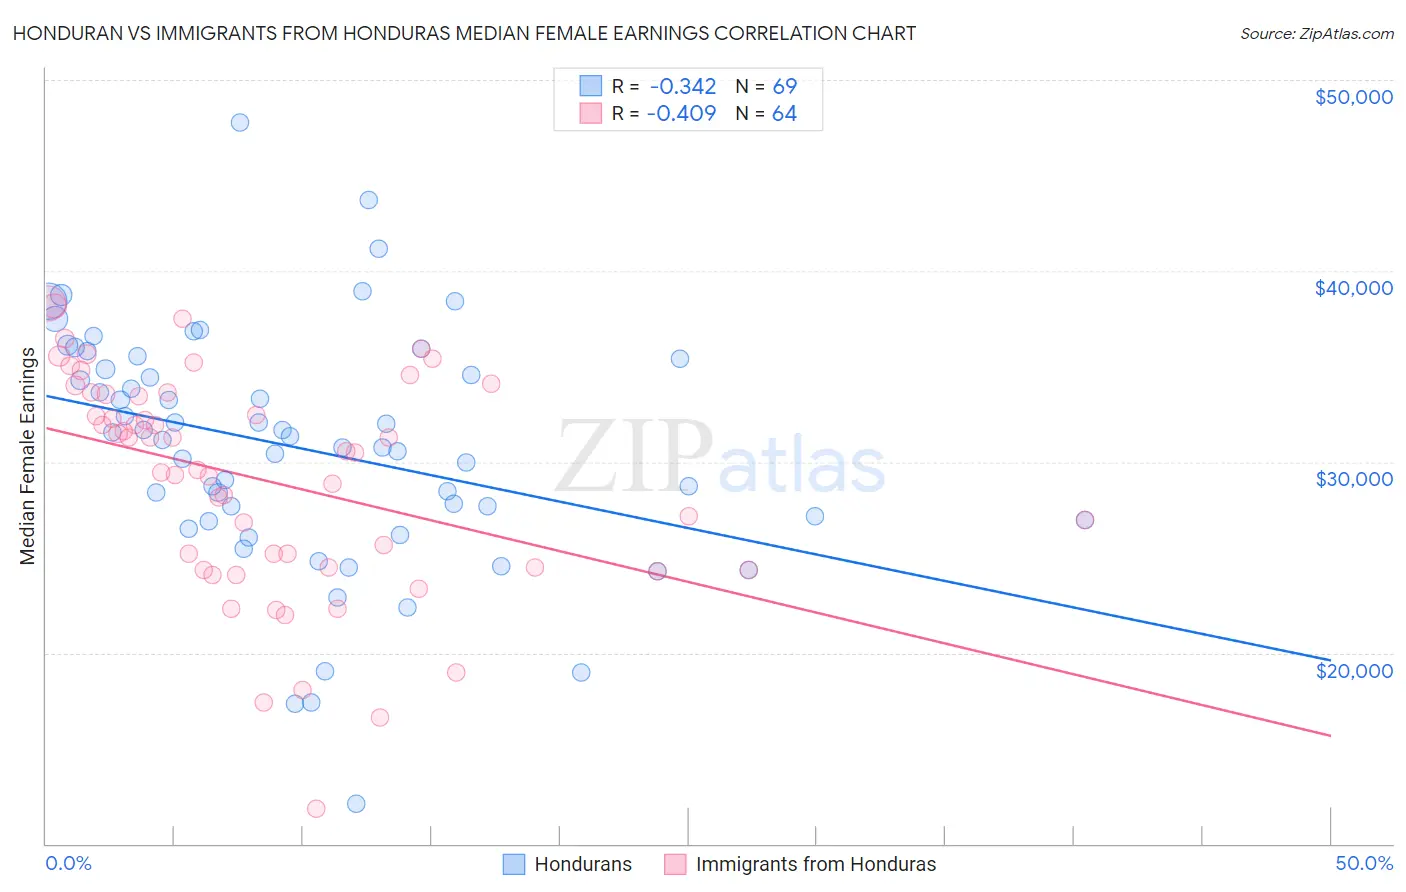
Honduran vs Immigrants from Honduras Median Female Earnings Correlation Chart
The statistical analysis conducted on geographies consisting of 357,702,253 people shows a mild negative correlation between the proportion of Hondurans and median female earnings in the United States with a correlation coefficient (R) of -0.342 and weighted average of $35,013. Similarly, the statistical analysis conducted on geographies consisting of 322,483,540 people shows a moderate negative correlation between the proportion of Immigrants from Honduras and median female earnings in the United States with a correlation coefficient (R) of -0.409 and weighted average of $34,647, a difference of 1.1%.
Median Female Earnings Correlation Summary
| Measurement | Honduran | Immigrants from Honduras |
| Minimum | $12,102 | $11,806 |
| Maximum | $47,798 | $38,285 |
| Range | $35,696 | $26,479 |
| Mean | $30,670 | $29,050 |
| Median | $31,162 | $30,512 |
| Interquartile 25% (IQ1) | $26,901 | $24,494 |
| Interquartile 75% (IQ3) | $35,123 | $33,580 |
| Interquartile Range (IQR) | $8,221 | $9,087 |
| Standard Deviation (Sample) | $6,330 | $5,773 |
| Standard Deviation (Population) | $6,284 | $5,727 |
Demographics Similar to Hondurans and Immigrants from Honduras by Median Female Earnings
In terms of median female earnings, the demographic groups most similar to Hondurans are Chippewa ($35,003, a difference of 0.030%), Immigrants from Bahamas ($35,027, a difference of 0.040%), Sioux ($35,063, a difference of 0.14%), Ute ($34,960, a difference of 0.15%), and Yaqui ($34,943, a difference of 0.20%). Similarly, the demographic groups most similar to Immigrants from Honduras are Shoshone ($34,677, a difference of 0.090%), Immigrants from Yemen ($34,693, a difference of 0.13%), Cherokee ($34,742, a difference of 0.27%), Potawatomi ($34,739, a difference of 0.27%), and Pennsylvania German ($34,802, a difference of 0.45%).
| Demographics | Rating | Rank | Median Female Earnings |
| Crow | 0.0 /100 | #304 | Tragic $35,266 |
| Bahamians | 0.0 /100 | #305 | Tragic $35,125 |
| Fijians | 0.0 /100 | #306 | Tragic $35,114 |
| Sioux | 0.0 /100 | #307 | Tragic $35,063 |
| Immigrants | Bahamas | 0.0 /100 | #308 | Tragic $35,027 |
| Hondurans | 0.0 /100 | #309 | Tragic $35,013 |
| Chippewa | 0.0 /100 | #310 | Tragic $35,003 |
| Ute | 0.0 /100 | #311 | Tragic $34,960 |
| Yaqui | 0.0 /100 | #312 | Tragic $34,943 |
| Cubans | 0.0 /100 | #313 | Tragic $34,942 |
| Apache | 0.0 /100 | #314 | Tragic $34,895 |
| Pennsylvania Germans | 0.0 /100 | #315 | Tragic $34,802 |
| Cherokee | 0.0 /100 | #316 | Tragic $34,742 |
| Potawatomi | 0.0 /100 | #317 | Tragic $34,739 |
| Immigrants | Yemen | 0.0 /100 | #318 | Tragic $34,693 |
| Shoshone | 0.0 /100 | #319 | Tragic $34,677 |
| Immigrants | Honduras | 0.0 /100 | #320 | Tragic $34,647 |
| Hispanics or Latinos | 0.0 /100 | #321 | Tragic $34,421 |
| Chickasaw | 0.0 /100 | #322 | Tragic $34,414 |
| Seminole | 0.0 /100 | #323 | Tragic $34,385 |
| Immigrants | Congo | 0.0 /100 | #324 | Tragic $34,317 |