Immigrants from Costa Rica vs Immigrants from Albania Median Household Income
COMPARE
Immigrants from Costa Rica
Immigrants from Albania
Median Household Income
Median Household Income Comparison
Immigrants from Costa Rica
Immigrants from Albania
$85,054
MEDIAN HOUSEHOLD INCOME
49.2/ 100
METRIC RATING
175th/ 347
METRIC RANK
$86,534
MEDIAN HOUSEHOLD INCOME
71.5/ 100
METRIC RATING
156th/ 347
METRIC RANK
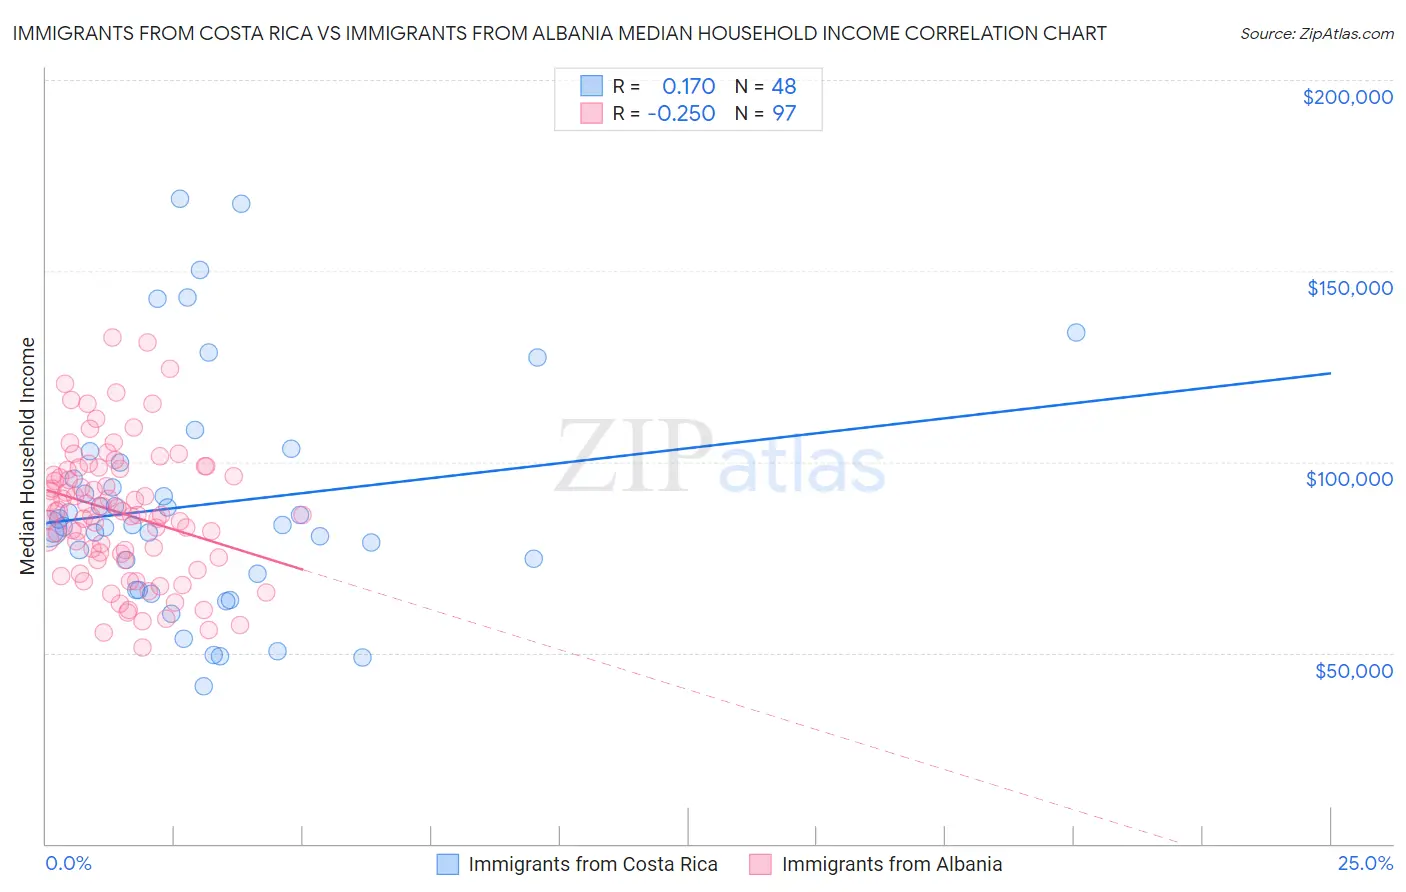
Immigrants from Costa Rica vs Immigrants from Albania Median Household Income Correlation Chart
The statistical analysis conducted on geographies consisting of 204,222,655 people shows a poor positive correlation between the proportion of Immigrants from Costa Rica and median household income in the United States with a correlation coefficient (R) of 0.170 and weighted average of $85,054. Similarly, the statistical analysis conducted on geographies consisting of 119,343,332 people shows a weak negative correlation between the proportion of Immigrants from Albania and median household income in the United States with a correlation coefficient (R) of -0.250 and weighted average of $86,534, a difference of 1.7%.
Median Household Income Correlation Summary
| Measurement | Immigrants from Costa Rica | Immigrants from Albania |
| Minimum | $41,250 | $51,316 |
| Maximum | $168,837 | $132,457 |
| Range | $127,587 | $81,141 |
| Mean | $88,867 | $86,652 |
| Median | $83,191 | $86,175 |
| Interquartile 25% (IQ1) | $68,706 | $74,686 |
| Interquartile 75% (IQ3) | $97,715 | $98,070 |
| Interquartile Range (IQR) | $29,008 | $23,384 |
| Standard Deviation (Sample) | $30,266 | $17,379 |
| Standard Deviation (Population) | $29,949 | $17,290 |
Demographics Similar to Immigrants from Costa Rica and Immigrants from Albania by Median Household Income
In terms of median household income, the demographic groups most similar to Immigrants from Costa Rica are Scottish ($85,101, a difference of 0.050%), Immigrants from Cameroon ($85,314, a difference of 0.31%), Slovene ($85,562, a difference of 0.60%), Immigrants from South America ($85,611, a difference of 0.66%), and Swiss ($85,681, a difference of 0.74%). Similarly, the demographic groups most similar to Immigrants from Albania are Samoan ($86,498, a difference of 0.040%), Moroccan ($86,468, a difference of 0.080%), Carpatho Rusyn ($86,635, a difference of 0.12%), Immigrants from Uzbekistan ($86,425, a difference of 0.13%), and Luxembourger ($86,418, a difference of 0.13%).
| Demographics | Rating | Rank | Median Household Income |
| Carpatho Rusyns | 72.8 /100 | #155 | Good $86,635 |
| Immigrants | Albania | 71.5 /100 | #156 | Good $86,534 |
| Samoans | 71.0 /100 | #157 | Good $86,498 |
| Moroccans | 70.6 /100 | #158 | Good $86,468 |
| Immigrants | Uzbekistan | 70.1 /100 | #159 | Good $86,425 |
| Luxembourgers | 70.0 /100 | #160 | Good $86,418 |
| Slavs | 69.7 /100 | #161 | Good $86,398 |
| Guamanians/Chamorros | 67.7 /100 | #162 | Good $86,255 |
| Czechs | 66.4 /100 | #163 | Good $86,164 |
| Irish | 66.2 /100 | #164 | Good $86,145 |
| Norwegians | 65.3 /100 | #165 | Good $86,084 |
| Scandinavians | 65.1 /100 | #166 | Good $86,073 |
| Immigrants | Immigrants | 61.3 /100 | #167 | Good $85,818 |
| Icelanders | 61.0 /100 | #168 | Good $85,797 |
| Colombians | 59.7 /100 | #169 | Average $85,716 |
| Swiss | 59.2 /100 | #170 | Average $85,681 |
| Immigrants | South America | 58.1 /100 | #171 | Average $85,611 |
| Slovenes | 57.4 /100 | #172 | Average $85,562 |
| Immigrants | Cameroon | 53.4 /100 | #173 | Average $85,314 |
| Scottish | 50.0 /100 | #174 | Average $85,101 |
| Immigrants | Costa Rica | 49.2 /100 | #175 | Average $85,054 |