Hmong vs Immigrants from Albania Unemployment Among Ages 25 to 29 years
COMPARE
Hmong
Immigrants from Albania
Unemployment Among Ages 25 to 29 years
Unemployment Among Ages 25 to 29 years Comparison
Hmong
Immigrants from Albania
5.7%
UNEMPLOYMENT AMONG AGES 25 TO 29 YEARS
100.0/ 100
METRIC RATING
6th/ 347
METRIC RANK
6.4%
UNEMPLOYMENT AMONG AGES 25 TO 29 YEARS
87.9/ 100
METRIC RATING
109th/ 347
METRIC RANK
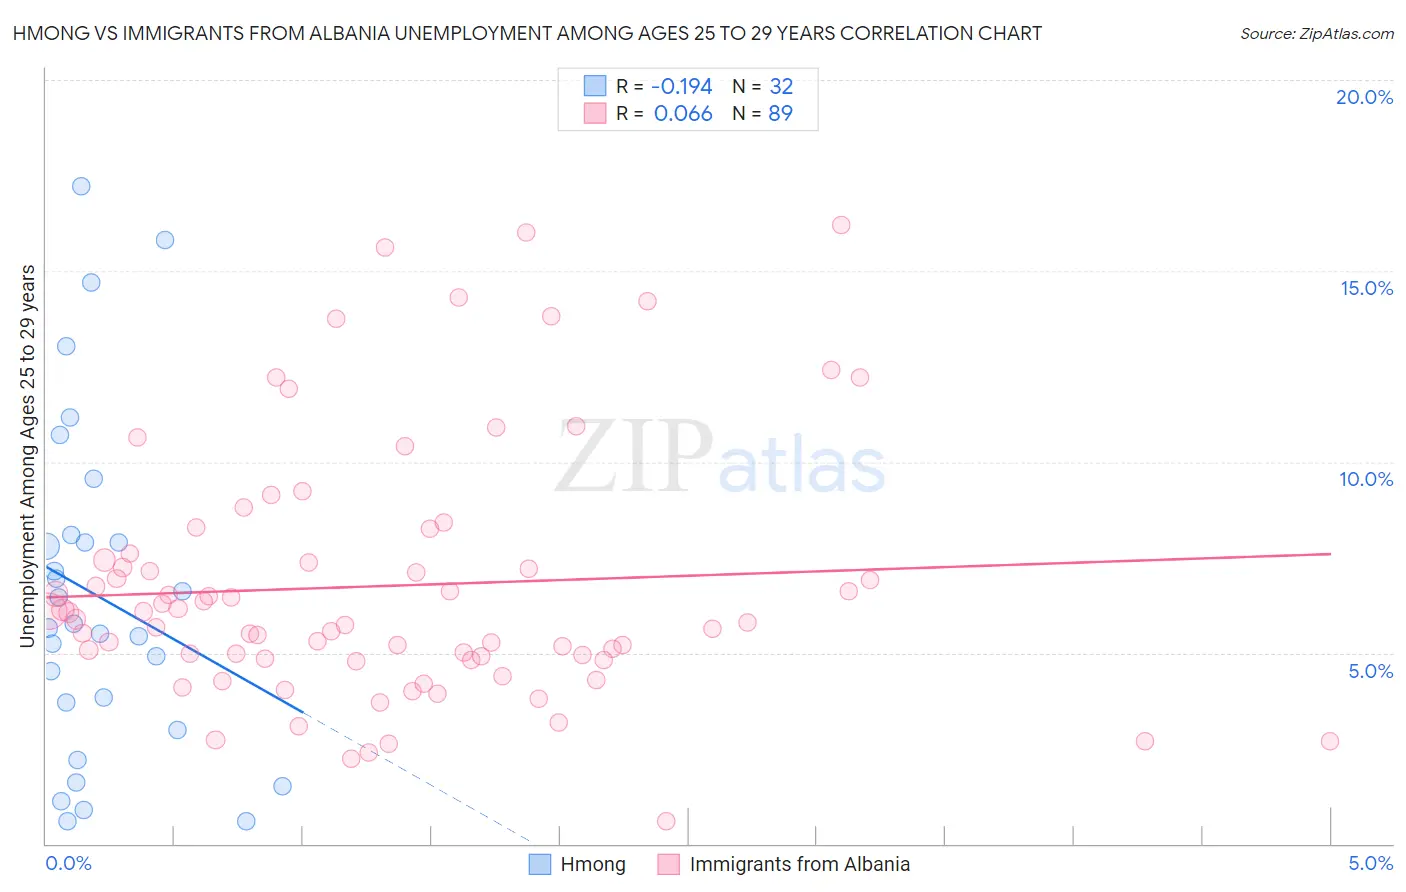
Hmong vs Immigrants from Albania Unemployment Among Ages 25 to 29 years Correlation Chart
The statistical analysis conducted on geographies consisting of 24,596,443 people shows a poor negative correlation between the proportion of Hmong and unemployment rate among population between the ages 25 and 29 in the United States with a correlation coefficient (R) of -0.194 and weighted average of 5.7%. Similarly, the statistical analysis conducted on geographies consisting of 117,024,271 people shows a slight positive correlation between the proportion of Immigrants from Albania and unemployment rate among population between the ages 25 and 29 in the United States with a correlation coefficient (R) of 0.066 and weighted average of 6.4%, a difference of 13.9%.
Unemployment Among Ages 25 to 29 years Correlation Summary
| Measurement | Hmong | Immigrants from Albania |
| Minimum | 0.60% | 0.60% |
| Maximum | 17.2% | 16.2% |
| Range | 16.6% | 15.6% |
| Mean | 6.5% | 6.8% |
| Median | 5.7% | 5.9% |
| Interquartile 25% (IQ1) | 3.3% | 4.8% |
| Interquartile 75% (IQ3) | 8.0% | 7.5% |
| Interquartile Range (IQR) | 4.7% | 2.7% |
| Standard Deviation (Sample) | 4.4% | 3.3% |
| Standard Deviation (Population) | 4.3% | 3.3% |
Similar Demographics by Unemployment Among Ages 25 to 29 years
Demographics Similar to Hmong by Unemployment Among Ages 25 to 29 years
In terms of unemployment among ages 25 to 29 years, the demographic groups most similar to Hmong are Immigrants from India (5.7%, a difference of 0.080%), Somali (5.6%, a difference of 0.19%), Immigrants from Bosnia and Herzegovina (5.7%, a difference of 0.20%), Immigrants from Cuba (5.6%, a difference of 0.26%), and Immigrants from Nepal (5.7%, a difference of 1.5%).
| Demographics | Rating | Rank | Unemployment Among Ages 25 to 29 years |
| Sudanese | 100.0 /100 | #1 | Exceptional 5.4% |
| Tongans | 100.0 /100 | #2 | Exceptional 5.5% |
| Immigrants | Somalia | 100.0 /100 | #3 | Exceptional 5.5% |
| Immigrants | Cuba | 100.0 /100 | #4 | Exceptional 5.6% |
| Somalis | 100.0 /100 | #5 | Exceptional 5.6% |
| Hmong | 100.0 /100 | #6 | Exceptional 5.7% |
| Immigrants | India | 100.0 /100 | #7 | Exceptional 5.7% |
| Immigrants | Bosnia and Herzegovina | 100.0 /100 | #8 | Exceptional 5.7% |
| Immigrants | Nepal | 100.0 /100 | #9 | Exceptional 5.7% |
| Immigrants | Sudan | 100.0 /100 | #10 | Exceptional 5.8% |
| Cambodians | 100.0 /100 | #11 | Exceptional 5.8% |
| Okinawans | 100.0 /100 | #12 | Exceptional 5.9% |
| Immigrants | Bolivia | 100.0 /100 | #13 | Exceptional 5.9% |
| Immigrants | Kuwait | 99.9 /100 | #14 | Exceptional 5.9% |
| Cubans | 99.9 /100 | #15 | Exceptional 5.9% |
Demographics Similar to Immigrants from Albania by Unemployment Among Ages 25 to 29 years
In terms of unemployment among ages 25 to 29 years, the demographic groups most similar to Immigrants from Albania are European (6.4%, a difference of 0.010%), Croatian (6.4%, a difference of 0.040%), Immigrants from Colombia (6.4%, a difference of 0.050%), Immigrants from Nicaragua (6.4%, a difference of 0.070%), and Swiss (6.4%, a difference of 0.10%).
| Demographics | Rating | Rank | Unemployment Among Ages 25 to 29 years |
| British | 90.5 /100 | #102 | Exceptional 6.4% |
| Immigrants | Congo | 90.4 /100 | #103 | Exceptional 6.4% |
| Cypriots | 90.1 /100 | #104 | Exceptional 6.4% |
| Immigrants | Kazakhstan | 89.8 /100 | #105 | Excellent 6.4% |
| Immigrants | Hungary | 89.4 /100 | #106 | Excellent 6.4% |
| Swiss | 88.6 /100 | #107 | Excellent 6.4% |
| Croatians | 88.2 /100 | #108 | Excellent 6.4% |
| Immigrants | Albania | 87.9 /100 | #109 | Excellent 6.4% |
| Europeans | 87.8 /100 | #110 | Excellent 6.4% |
| Immigrants | Colombia | 87.6 /100 | #111 | Excellent 6.4% |
| Immigrants | Nicaragua | 87.5 /100 | #112 | Excellent 6.4% |
| Immigrants | Egypt | 87.1 /100 | #113 | Excellent 6.5% |
| Germans | 86.3 /100 | #114 | Excellent 6.5% |
| Macedonians | 86.1 /100 | #115 | Excellent 6.5% |
| Pakistanis | 85.9 /100 | #116 | Excellent 6.5% |