Hispanic or Latino vs U.S. Virgin Islander Householder Income Ages 25 - 44 years
COMPARE
Hispanic or Latino
U.S. Virgin Islander
Householder Income Ages 25 - 44 years
Householder Income Ages 25 - 44 years Comparison
Hispanics or Latinos
U.S. Virgin Islanders
$80,515
HOUSEHOLDER INCOME AGES 25 - 44 YEARS
0.0/ 100
METRIC RATING
302nd/ 347
METRIC RANK
$78,911
HOUSEHOLDER INCOME AGES 25 - 44 YEARS
0.0/ 100
METRIC RATING
317th/ 347
METRIC RANK
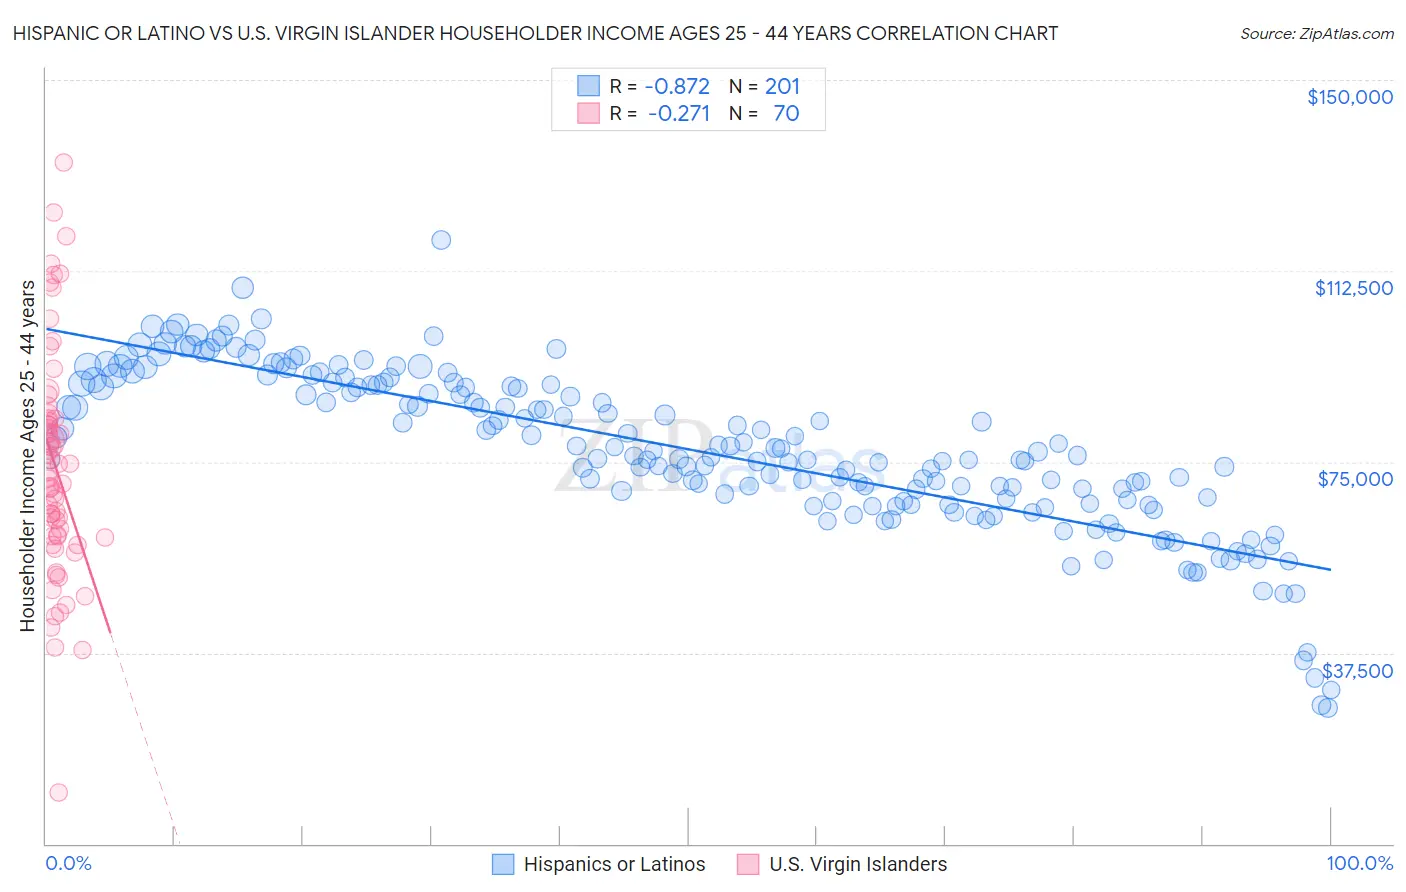
Hispanic or Latino vs U.S. Virgin Islander Householder Income Ages 25 - 44 years Correlation Chart
The statistical analysis conducted on geographies consisting of 571,919,072 people shows a very strong negative correlation between the proportion of Hispanics or Latinos and household income with householder between the ages 25 and 44 in the United States with a correlation coefficient (R) of -0.872 and weighted average of $80,515. Similarly, the statistical analysis conducted on geographies consisting of 87,500,789 people shows a weak negative correlation between the proportion of U.S. Virgin Islanders and household income with householder between the ages 25 and 44 in the United States with a correlation coefficient (R) of -0.271 and weighted average of $78,911, a difference of 2.0%.
Householder Income Ages 25 - 44 years Correlation Summary
| Measurement | Hispanic or Latino | U.S. Virgin Islander |
| Minimum | $26,720 | $10,066 |
| Maximum | $118,587 | $133,704 |
| Range | $91,867 | $123,638 |
| Mean | $77,340 | $73,982 |
| Median | $76,240 | $72,367 |
| Interquartile 25% (IQ1) | $67,336 | $60,369 |
| Interquartile 75% (IQ3) | $90,103 | $83,425 |
| Interquartile Range (IQR) | $22,768 | $23,056 |
| Standard Deviation (Sample) | $15,776 | $22,240 |
| Standard Deviation (Population) | $15,737 | $22,080 |
Demographics Similar to Hispanics or Latinos and U.S. Virgin Islanders by Householder Income Ages 25 - 44 years
In terms of householder income ages 25 - 44 years, the demographic groups most similar to Hispanics or Latinos are Immigrants from Micronesia ($80,544, a difference of 0.040%), Mexican ($80,427, a difference of 0.11%), Immigrants from Caribbean ($80,326, a difference of 0.24%), Immigrants from Dominican Republic ($80,319, a difference of 0.24%), and Apache ($80,260, a difference of 0.32%). Similarly, the demographic groups most similar to U.S. Virgin Islanders are African ($78,986, a difference of 0.090%), Ottawa ($79,012, a difference of 0.13%), Immigrants from Mexico ($78,809, a difference of 0.13%), Cheyenne ($79,152, a difference of 0.30%), and Honduran ($78,540, a difference of 0.47%).
| Demographics | Rating | Rank | Householder Income Ages 25 - 44 years |
| Immigrants | Liberia | 0.1 /100 | #299 | Tragic $80,863 |
| Cherokee | 0.0 /100 | #300 | Tragic $80,843 |
| Immigrants | Micronesia | 0.0 /100 | #301 | Tragic $80,544 |
| Hispanics or Latinos | 0.0 /100 | #302 | Tragic $80,515 |
| Mexicans | 0.0 /100 | #303 | Tragic $80,427 |
| Immigrants | Caribbean | 0.0 /100 | #304 | Tragic $80,326 |
| Immigrants | Dominican Republic | 0.0 /100 | #305 | Tragic $80,319 |
| Apache | 0.0 /100 | #306 | Tragic $80,260 |
| Haitians | 0.0 /100 | #307 | Tragic $80,055 |
| Immigrants | Central America | 0.0 /100 | #308 | Tragic $80,012 |
| Chippewa | 0.0 /100 | #309 | Tragic $80,005 |
| Fijians | 0.0 /100 | #310 | Tragic $79,956 |
| Indonesians | 0.0 /100 | #311 | Tragic $79,543 |
| Immigrants | Haiti | 0.0 /100 | #312 | Tragic $79,391 |
| Menominee | 0.0 /100 | #313 | Tragic $79,358 |
| Cheyenne | 0.0 /100 | #314 | Tragic $79,152 |
| Ottawa | 0.0 /100 | #315 | Tragic $79,012 |
| Africans | 0.0 /100 | #316 | Tragic $78,986 |
| U.S. Virgin Islanders | 0.0 /100 | #317 | Tragic $78,911 |
| Immigrants | Mexico | 0.0 /100 | #318 | Tragic $78,809 |
| Hondurans | 0.0 /100 | #319 | Tragic $78,540 |