Inupiat vs U.S. Virgin Islander Householder Income Ages 25 - 44 years
COMPARE
Inupiat
U.S. Virgin Islander
Householder Income Ages 25 - 44 years
Householder Income Ages 25 - 44 years Comparison
Inupiat
U.S. Virgin Islanders
$84,619
HOUSEHOLDER INCOME AGES 25 - 44 YEARS
0.4/ 100
METRIC RATING
261st/ 347
METRIC RANK
$78,911
HOUSEHOLDER INCOME AGES 25 - 44 YEARS
0.0/ 100
METRIC RATING
317th/ 347
METRIC RANK
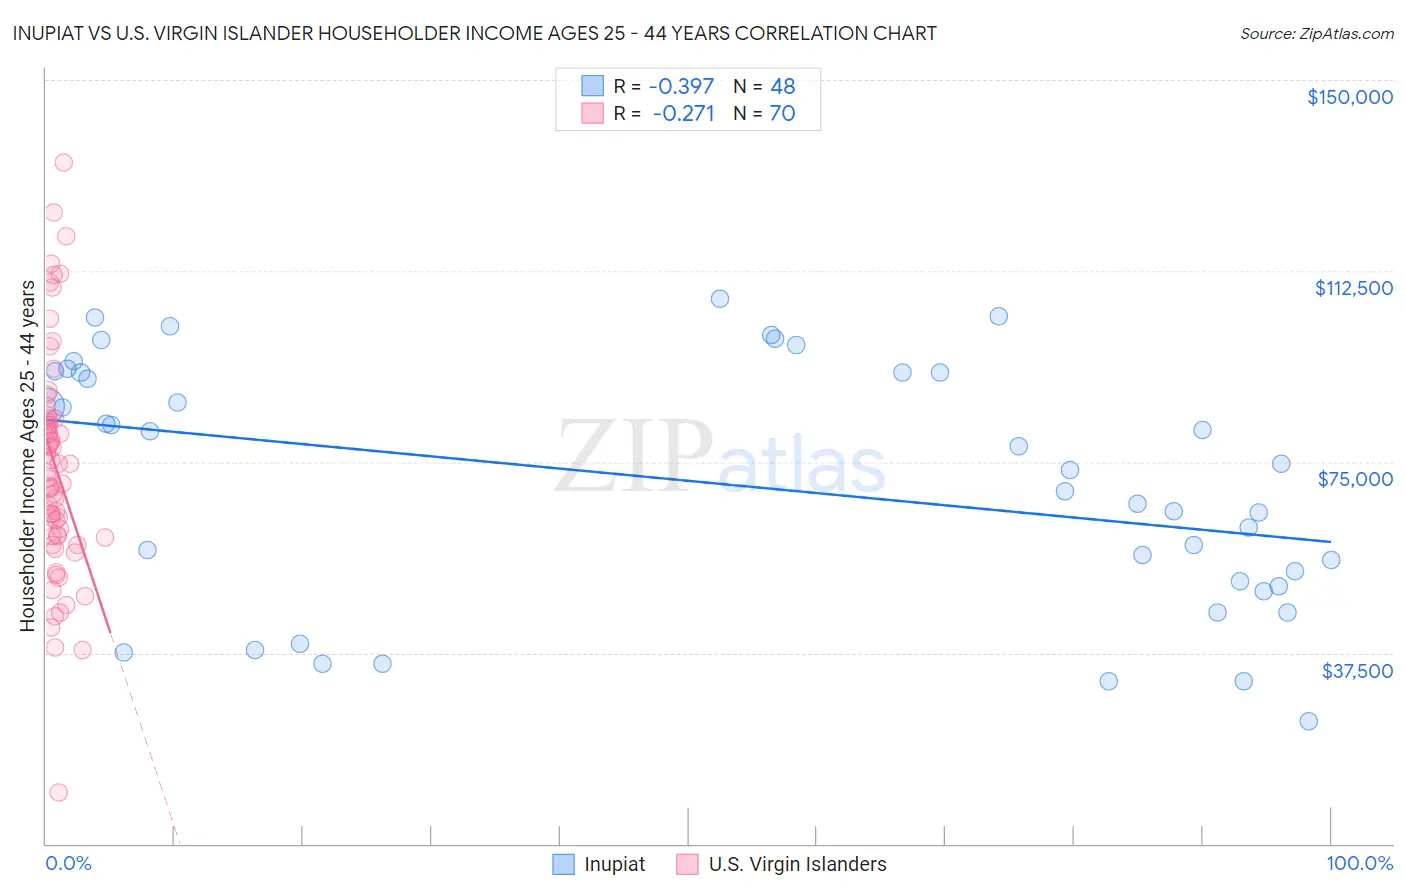
Inupiat vs U.S. Virgin Islander Householder Income Ages 25 - 44 years Correlation Chart
The statistical analysis conducted on geographies consisting of 96,221,283 people shows a mild negative correlation between the proportion of Inupiat and household income with householder between the ages 25 and 44 in the United States with a correlation coefficient (R) of -0.397 and weighted average of $84,619. Similarly, the statistical analysis conducted on geographies consisting of 87,500,789 people shows a weak negative correlation between the proportion of U.S. Virgin Islanders and household income with householder between the ages 25 and 44 in the United States with a correlation coefficient (R) of -0.271 and weighted average of $78,911, a difference of 7.2%.
Householder Income Ages 25 - 44 years Correlation Summary
| Measurement | Inupiat | U.S. Virgin Islander |
| Minimum | $24,167 | $10,066 |
| Maximum | $106,917 | $133,704 |
| Range | $82,750 | $123,638 |
| Mean | $70,828 | $73,982 |
| Median | $74,010 | $72,367 |
| Interquartile 25% (IQ1) | $51,032 | $60,369 |
| Interquartile 75% (IQ3) | $92,639 | $83,425 |
| Interquartile Range (IQR) | $41,608 | $23,056 |
| Standard Deviation (Sample) | $23,899 | $22,240 |
| Standard Deviation (Population) | $23,649 | $22,080 |
Similar Demographics by Householder Income Ages 25 - 44 years
Demographics Similar to Inupiat by Householder Income Ages 25 - 44 years
In terms of householder income ages 25 - 44 years, the demographic groups most similar to Inupiat are Cree ($84,574, a difference of 0.050%), Belizean ($84,534, a difference of 0.10%), Osage ($84,461, a difference of 0.19%), American ($84,791, a difference of 0.20%), and Sudanese ($84,401, a difference of 0.26%).
| Demographics | Rating | Rank | Householder Income Ages 25 - 44 years |
| Immigrants | Laos | 0.7 /100 | #254 | Tragic $85,553 |
| German Russians | 0.6 /100 | #255 | Tragic $85,220 |
| Central Americans | 0.5 /100 | #256 | Tragic $85,144 |
| Mexican American Indians | 0.5 /100 | #257 | Tragic $85,066 |
| Immigrants | Nicaragua | 0.5 /100 | #258 | Tragic $84,914 |
| Immigrants | Senegal | 0.5 /100 | #259 | Tragic $84,848 |
| Americans | 0.4 /100 | #260 | Tragic $84,791 |
| Inupiat | 0.4 /100 | #261 | Tragic $84,619 |
| Cree | 0.4 /100 | #262 | Tragic $84,574 |
| Belizeans | 0.4 /100 | #263 | Tragic $84,534 |
| Osage | 0.4 /100 | #264 | Tragic $84,461 |
| Sudanese | 0.4 /100 | #265 | Tragic $84,401 |
| Immigrants | Cabo Verde | 0.3 /100 | #266 | Tragic $84,304 |
| Hmong | 0.3 /100 | #267 | Tragic $84,258 |
| Sub-Saharan Africans | 0.3 /100 | #268 | Tragic $84,235 |
Demographics Similar to U.S. Virgin Islanders by Householder Income Ages 25 - 44 years
In terms of householder income ages 25 - 44 years, the demographic groups most similar to U.S. Virgin Islanders are African ($78,986, a difference of 0.090%), Ottawa ($79,012, a difference of 0.13%), Immigrants from Mexico ($78,809, a difference of 0.13%), Cheyenne ($79,152, a difference of 0.30%), and Honduran ($78,540, a difference of 0.47%).
| Demographics | Rating | Rank | Householder Income Ages 25 - 44 years |
| Fijians | 0.0 /100 | #310 | Tragic $79,956 |
| Indonesians | 0.0 /100 | #311 | Tragic $79,543 |
| Immigrants | Haiti | 0.0 /100 | #312 | Tragic $79,391 |
| Menominee | 0.0 /100 | #313 | Tragic $79,358 |
| Cheyenne | 0.0 /100 | #314 | Tragic $79,152 |
| Ottawa | 0.0 /100 | #315 | Tragic $79,012 |
| Africans | 0.0 /100 | #316 | Tragic $78,986 |
| U.S. Virgin Islanders | 0.0 /100 | #317 | Tragic $78,911 |
| Immigrants | Mexico | 0.0 /100 | #318 | Tragic $78,809 |
| Hondurans | 0.0 /100 | #319 | Tragic $78,540 |
| Choctaw | 0.0 /100 | #320 | Tragic $78,168 |
| Immigrants | Zaire | 0.0 /100 | #321 | Tragic $78,045 |
| Chickasaw | 0.0 /100 | #322 | Tragic $77,929 |
| Immigrants | Honduras | 0.0 /100 | #323 | Tragic $77,328 |
| Dutch West Indians | 0.0 /100 | #324 | Tragic $77,260 |