Hispanic or Latino vs Immigrants from Egypt Householder Income Ages 25 - 44 years
COMPARE
Hispanic or Latino
Immigrants from Egypt
Householder Income Ages 25 - 44 years
Householder Income Ages 25 - 44 years Comparison
Hispanics or Latinos
Immigrants from Egypt
$80,515
HOUSEHOLDER INCOME AGES 25 - 44 YEARS
0.0/ 100
METRIC RATING
302nd/ 347
METRIC RANK
$103,192
HOUSEHOLDER INCOME AGES 25 - 44 YEARS
99.2/ 100
METRIC RATING
80th/ 347
METRIC RANK
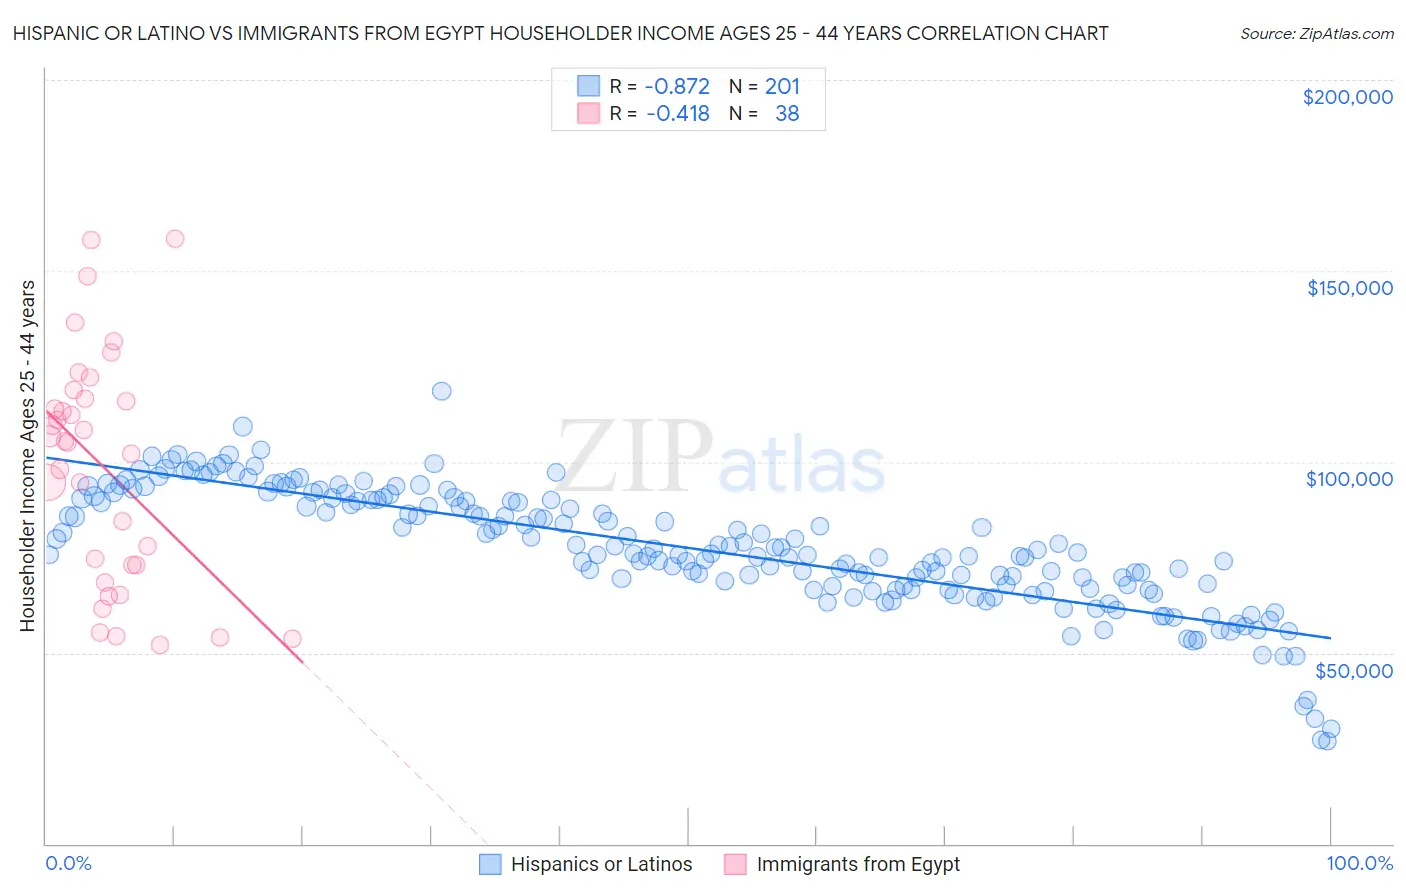
Hispanic or Latino vs Immigrants from Egypt Householder Income Ages 25 - 44 years Correlation Chart
The statistical analysis conducted on geographies consisting of 571,919,072 people shows a very strong negative correlation between the proportion of Hispanics or Latinos and household income with householder between the ages 25 and 44 in the United States with a correlation coefficient (R) of -0.872 and weighted average of $80,515. Similarly, the statistical analysis conducted on geographies consisting of 245,137,860 people shows a moderate negative correlation between the proportion of Immigrants from Egypt and household income with householder between the ages 25 and 44 in the United States with a correlation coefficient (R) of -0.418 and weighted average of $103,192, a difference of 28.2%.
Householder Income Ages 25 - 44 years Correlation Summary
| Measurement | Hispanic or Latino | Immigrants from Egypt |
| Minimum | $26,720 | $52,083 |
| Maximum | $118,587 | $158,487 |
| Range | $91,867 | $106,404 |
| Mean | $77,340 | $98,589 |
| Median | $76,240 | $105,246 |
| Interquartile 25% (IQ1) | $67,336 | $73,125 |
| Interquartile 75% (IQ3) | $90,103 | $116,638 |
| Interquartile Range (IQR) | $22,768 | $43,513 |
| Standard Deviation (Sample) | $15,776 | $30,067 |
| Standard Deviation (Population) | $15,737 | $29,669 |
Similar Demographics by Householder Income Ages 25 - 44 years
Demographics Similar to Hispanics or Latinos by Householder Income Ages 25 - 44 years
In terms of householder income ages 25 - 44 years, the demographic groups most similar to Hispanics or Latinos are Immigrants from Micronesia ($80,544, a difference of 0.040%), Mexican ($80,427, a difference of 0.11%), Immigrants from Caribbean ($80,326, a difference of 0.24%), Immigrants from Dominican Republic ($80,319, a difference of 0.24%), and Apache ($80,260, a difference of 0.32%).
| Demographics | Rating | Rank | Householder Income Ages 25 - 44 years |
| Bangladeshis | 0.1 /100 | #295 | Tragic $81,363 |
| Immigrants | Dominica | 0.1 /100 | #296 | Tragic $81,351 |
| Immigrants | Guatemala | 0.1 /100 | #297 | Tragic $81,341 |
| Dominicans | 0.1 /100 | #298 | Tragic $81,229 |
| Immigrants | Liberia | 0.1 /100 | #299 | Tragic $80,863 |
| Cherokee | 0.0 /100 | #300 | Tragic $80,843 |
| Immigrants | Micronesia | 0.0 /100 | #301 | Tragic $80,544 |
| Hispanics or Latinos | 0.0 /100 | #302 | Tragic $80,515 |
| Mexicans | 0.0 /100 | #303 | Tragic $80,427 |
| Immigrants | Caribbean | 0.0 /100 | #304 | Tragic $80,326 |
| Immigrants | Dominican Republic | 0.0 /100 | #305 | Tragic $80,319 |
| Apache | 0.0 /100 | #306 | Tragic $80,260 |
| Haitians | 0.0 /100 | #307 | Tragic $80,055 |
| Immigrants | Central America | 0.0 /100 | #308 | Tragic $80,012 |
| Chippewa | 0.0 /100 | #309 | Tragic $80,005 |
Demographics Similar to Immigrants from Egypt by Householder Income Ages 25 - 44 years
In terms of householder income ages 25 - 44 years, the demographic groups most similar to Immigrants from Egypt are South African ($103,160, a difference of 0.030%), Immigrants from Serbia ($103,155, a difference of 0.040%), Armenian ($103,248, a difference of 0.050%), Argentinean ($103,111, a difference of 0.080%), and Immigrants from Bulgaria ($103,423, a difference of 0.22%).
| Demographics | Rating | Rank | Householder Income Ages 25 - 44 years |
| Italians | 99.5 /100 | #73 | Exceptional $104,215 |
| Immigrants | Fiji | 99.5 /100 | #74 | Exceptional $103,954 |
| Koreans | 99.4 /100 | #75 | Exceptional $103,824 |
| Immigrants | Spain | 99.4 /100 | #76 | Exceptional $103,752 |
| Immigrants | Southern Europe | 99.3 /100 | #77 | Exceptional $103,486 |
| Immigrants | Bulgaria | 99.3 /100 | #78 | Exceptional $103,423 |
| Armenians | 99.2 /100 | #79 | Exceptional $103,248 |
| Immigrants | Egypt | 99.2 /100 | #80 | Exceptional $103,192 |
| South Africans | 99.2 /100 | #81 | Exceptional $103,160 |
| Immigrants | Serbia | 99.2 /100 | #82 | Exceptional $103,155 |
| Argentineans | 99.1 /100 | #83 | Exceptional $103,111 |
| Immigrants | Philippines | 99.0 /100 | #84 | Exceptional $102,910 |
| Immigrants | Ukraine | 98.9 /100 | #85 | Exceptional $102,664 |
| Immigrants | Hungary | 98.9 /100 | #86 | Exceptional $102,655 |
| Immigrants | Western Europe | 98.9 /100 | #87 | Exceptional $102,654 |