Hispanic or Latino vs Ghanaian Householder Income Ages 25 - 44 years
COMPARE
Hispanic or Latino
Ghanaian
Householder Income Ages 25 - 44 years
Householder Income Ages 25 - 44 years Comparison
Hispanics or Latinos
Ghanaians
$80,515
HOUSEHOLDER INCOME AGES 25 - 44 YEARS
0.0/ 100
METRIC RATING
302nd/ 347
METRIC RANK
$90,137
HOUSEHOLDER INCOME AGES 25 - 44 YEARS
7.9/ 100
METRIC RATING
216th/ 347
METRIC RANK
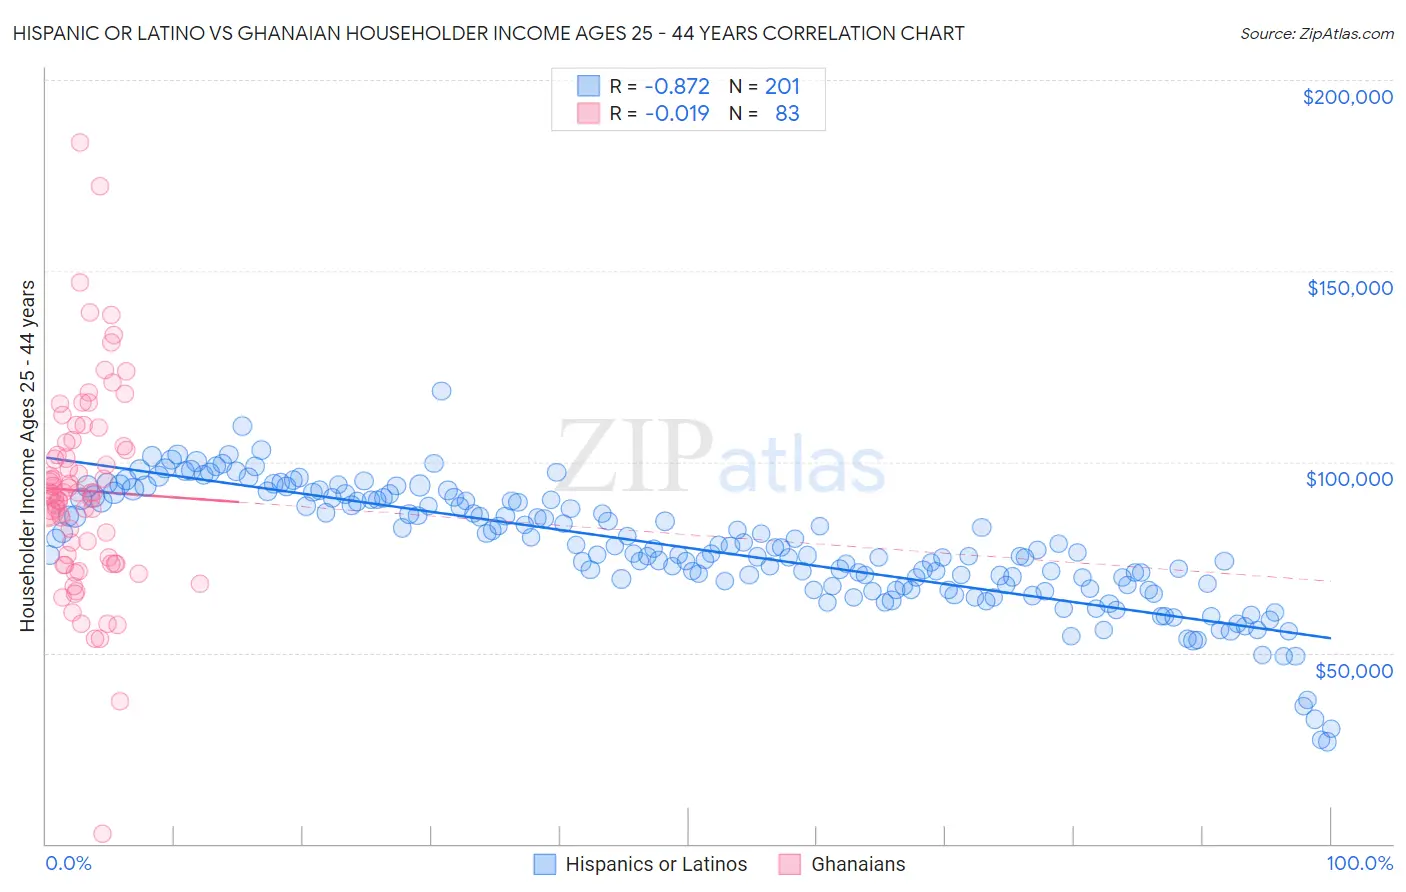
Hispanic or Latino vs Ghanaian Householder Income Ages 25 - 44 years Correlation Chart
The statistical analysis conducted on geographies consisting of 571,919,072 people shows a very strong negative correlation between the proportion of Hispanics or Latinos and household income with householder between the ages 25 and 44 in the United States with a correlation coefficient (R) of -0.872 and weighted average of $80,515. Similarly, the statistical analysis conducted on geographies consisting of 190,400,180 people shows no correlation between the proportion of Ghanaians and household income with householder between the ages 25 and 44 in the United States with a correlation coefficient (R) of -0.019 and weighted average of $90,137, a difference of 11.9%.
Householder Income Ages 25 - 44 years Correlation Summary
| Measurement | Hispanic or Latino | Ghanaian |
| Minimum | $26,720 | $2,499 |
| Maximum | $118,587 | $183,644 |
| Range | $91,867 | $181,145 |
| Mean | $77,340 | $92,427 |
| Median | $76,240 | $91,588 |
| Interquartile 25% (IQ1) | $67,336 | $73,476 |
| Interquartile 75% (IQ3) | $90,103 | $104,966 |
| Interquartile Range (IQR) | $22,768 | $31,489 |
| Standard Deviation (Sample) | $15,776 | $27,016 |
| Standard Deviation (Population) | $15,737 | $26,853 |
Similar Demographics by Householder Income Ages 25 - 44 years
Demographics Similar to Hispanics or Latinos by Householder Income Ages 25 - 44 years
In terms of householder income ages 25 - 44 years, the demographic groups most similar to Hispanics or Latinos are Immigrants from Micronesia ($80,544, a difference of 0.040%), Mexican ($80,427, a difference of 0.11%), Immigrants from Caribbean ($80,326, a difference of 0.24%), Immigrants from Dominican Republic ($80,319, a difference of 0.24%), and Apache ($80,260, a difference of 0.32%).
| Demographics | Rating | Rank | Householder Income Ages 25 - 44 years |
| Bangladeshis | 0.1 /100 | #295 | Tragic $81,363 |
| Immigrants | Dominica | 0.1 /100 | #296 | Tragic $81,351 |
| Immigrants | Guatemala | 0.1 /100 | #297 | Tragic $81,341 |
| Dominicans | 0.1 /100 | #298 | Tragic $81,229 |
| Immigrants | Liberia | 0.1 /100 | #299 | Tragic $80,863 |
| Cherokee | 0.0 /100 | #300 | Tragic $80,843 |
| Immigrants | Micronesia | 0.0 /100 | #301 | Tragic $80,544 |
| Hispanics or Latinos | 0.0 /100 | #302 | Tragic $80,515 |
| Mexicans | 0.0 /100 | #303 | Tragic $80,427 |
| Immigrants | Caribbean | 0.0 /100 | #304 | Tragic $80,326 |
| Immigrants | Dominican Republic | 0.0 /100 | #305 | Tragic $80,319 |
| Apache | 0.0 /100 | #306 | Tragic $80,260 |
| Haitians | 0.0 /100 | #307 | Tragic $80,055 |
| Immigrants | Central America | 0.0 /100 | #308 | Tragic $80,012 |
| Chippewa | 0.0 /100 | #309 | Tragic $80,005 |
Demographics Similar to Ghanaians by Householder Income Ages 25 - 44 years
In terms of householder income ages 25 - 44 years, the demographic groups most similar to Ghanaians are Panamanian ($90,193, a difference of 0.060%), Scotch-Irish ($89,969, a difference of 0.19%), Guyanese ($89,940, a difference of 0.22%), Immigrants from Africa ($90,372, a difference of 0.26%), and Delaware ($89,876, a difference of 0.29%).
| Demographics | Rating | Rank | Householder Income Ages 25 - 44 years |
| Immigrants | Uruguay | 13.2 /100 | #209 | Poor $91,171 |
| Immigrants | Kenya | 10.9 /100 | #210 | Poor $90,767 |
| Iraqis | 10.8 /100 | #211 | Poor $90,764 |
| Hawaiians | 10.6 /100 | #212 | Poor $90,722 |
| Immigrants | Bangladesh | 9.3 /100 | #213 | Tragic $90,448 |
| Immigrants | Africa | 8.9 /100 | #214 | Tragic $90,372 |
| Panamanians | 8.1 /100 | #215 | Tragic $90,193 |
| Ghanaians | 7.9 /100 | #216 | Tragic $90,137 |
| Scotch-Irish | 7.3 /100 | #217 | Tragic $89,969 |
| Guyanese | 7.1 /100 | #218 | Tragic $89,940 |
| Delaware | 6.9 /100 | #219 | Tragic $89,876 |
| Trinidadians and Tobagonians | 6.8 /100 | #220 | Tragic $89,856 |
| Immigrants | Trinidad and Tobago | 6.5 /100 | #221 | Tragic $89,748 |
| Immigrants | Ecuador | 6.2 /100 | #222 | Tragic $89,673 |
| Immigrants | Guyana | 5.9 /100 | #223 | Tragic $89,586 |