Hispanic or Latino vs Immigrants from Guatemala Householder Income Ages 25 - 44 years
COMPARE
Hispanic or Latino
Immigrants from Guatemala
Householder Income Ages 25 - 44 years
Householder Income Ages 25 - 44 years Comparison
Hispanics or Latinos
Immigrants from Guatemala
$80,515
HOUSEHOLDER INCOME AGES 25 - 44 YEARS
0.0/ 100
METRIC RATING
302nd/ 347
METRIC RANK
$81,341
HOUSEHOLDER INCOME AGES 25 - 44 YEARS
0.1/ 100
METRIC RATING
297th/ 347
METRIC RANK
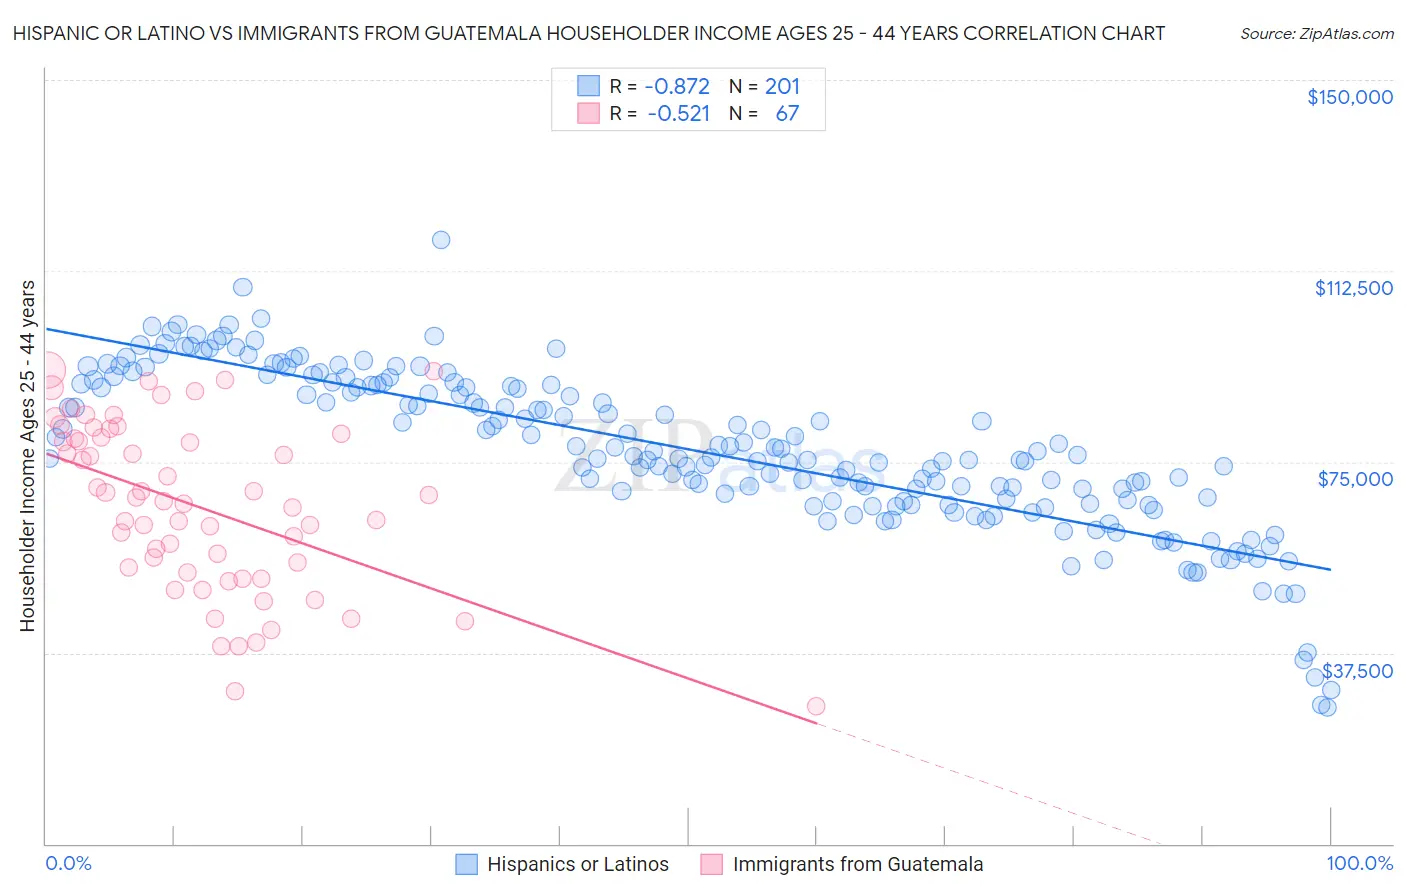
Hispanic or Latino vs Immigrants from Guatemala Householder Income Ages 25 - 44 years Correlation Chart
The statistical analysis conducted on geographies consisting of 571,919,072 people shows a very strong negative correlation between the proportion of Hispanics or Latinos and household income with householder between the ages 25 and 44 in the United States with a correlation coefficient (R) of -0.872 and weighted average of $80,515. Similarly, the statistical analysis conducted on geographies consisting of 376,665,002 people shows a substantial negative correlation between the proportion of Immigrants from Guatemala and household income with householder between the ages 25 and 44 in the United States with a correlation coefficient (R) of -0.521 and weighted average of $81,341, a difference of 1.0%.
Householder Income Ages 25 - 44 years Correlation Summary
| Measurement | Hispanic or Latino | Immigrants from Guatemala |
| Minimum | $26,720 | $26,896 |
| Maximum | $118,587 | $93,165 |
| Range | $91,867 | $66,269 |
| Mean | $77,340 | $66,180 |
| Median | $76,240 | $67,229 |
| Interquartile 25% (IQ1) | $67,336 | $53,322 |
| Interquartile 75% (IQ3) | $90,103 | $79,855 |
| Interquartile Range (IQR) | $22,768 | $26,533 |
| Standard Deviation (Sample) | $15,776 | $16,514 |
| Standard Deviation (Population) | $15,737 | $16,390 |
Demographics Similar to Hispanics or Latinos and Immigrants from Guatemala by Householder Income Ages 25 - 44 years
In terms of householder income ages 25 - 44 years, the demographic groups most similar to Hispanics or Latinos are Immigrants from Micronesia ($80,544, a difference of 0.040%), Mexican ($80,427, a difference of 0.11%), Immigrants from Caribbean ($80,326, a difference of 0.24%), Immigrants from Dominican Republic ($80,319, a difference of 0.24%), and Apache ($80,260, a difference of 0.32%). Similarly, the demographic groups most similar to Immigrants from Guatemala are Immigrants from Dominica ($81,351, a difference of 0.010%), Bangladeshi ($81,363, a difference of 0.030%), Dominican ($81,229, a difference of 0.14%), Cuban ($81,483, a difference of 0.17%), and Blackfeet ($81,531, a difference of 0.23%).
| Demographics | Rating | Rank | Householder Income Ages 25 - 44 years |
| Shoshone | 0.1 /100 | #289 | Tragic $82,062 |
| Liberians | 0.1 /100 | #290 | Tragic $82,005 |
| Potawatomi | 0.1 /100 | #291 | Tragic $81,774 |
| Yaqui | 0.1 /100 | #292 | Tragic $81,656 |
| Blackfeet | 0.1 /100 | #293 | Tragic $81,531 |
| Cubans | 0.1 /100 | #294 | Tragic $81,483 |
| Bangladeshis | 0.1 /100 | #295 | Tragic $81,363 |
| Immigrants | Dominica | 0.1 /100 | #296 | Tragic $81,351 |
| Immigrants | Guatemala | 0.1 /100 | #297 | Tragic $81,341 |
| Dominicans | 0.1 /100 | #298 | Tragic $81,229 |
| Immigrants | Liberia | 0.1 /100 | #299 | Tragic $80,863 |
| Cherokee | 0.0 /100 | #300 | Tragic $80,843 |
| Immigrants | Micronesia | 0.0 /100 | #301 | Tragic $80,544 |
| Hispanics or Latinos | 0.0 /100 | #302 | Tragic $80,515 |
| Mexicans | 0.0 /100 | #303 | Tragic $80,427 |
| Immigrants | Caribbean | 0.0 /100 | #304 | Tragic $80,326 |
| Immigrants | Dominican Republic | 0.0 /100 | #305 | Tragic $80,319 |
| Apache | 0.0 /100 | #306 | Tragic $80,260 |
| Haitians | 0.0 /100 | #307 | Tragic $80,055 |
| Immigrants | Central America | 0.0 /100 | #308 | Tragic $80,012 |
| Chippewa | 0.0 /100 | #309 | Tragic $80,005 |