Ukrainian vs U.S. Virgin Islander Householder Income Ages 25 - 44 years
COMPARE
Ukrainian
U.S. Virgin Islander
Householder Income Ages 25 - 44 years
Householder Income Ages 25 - 44 years Comparison
Ukrainians
U.S. Virgin Islanders
$102,451
HOUSEHOLDER INCOME AGES 25 - 44 YEARS
98.8/ 100
METRIC RATING
90th/ 347
METRIC RANK
$78,911
HOUSEHOLDER INCOME AGES 25 - 44 YEARS
0.0/ 100
METRIC RATING
317th/ 347
METRIC RANK
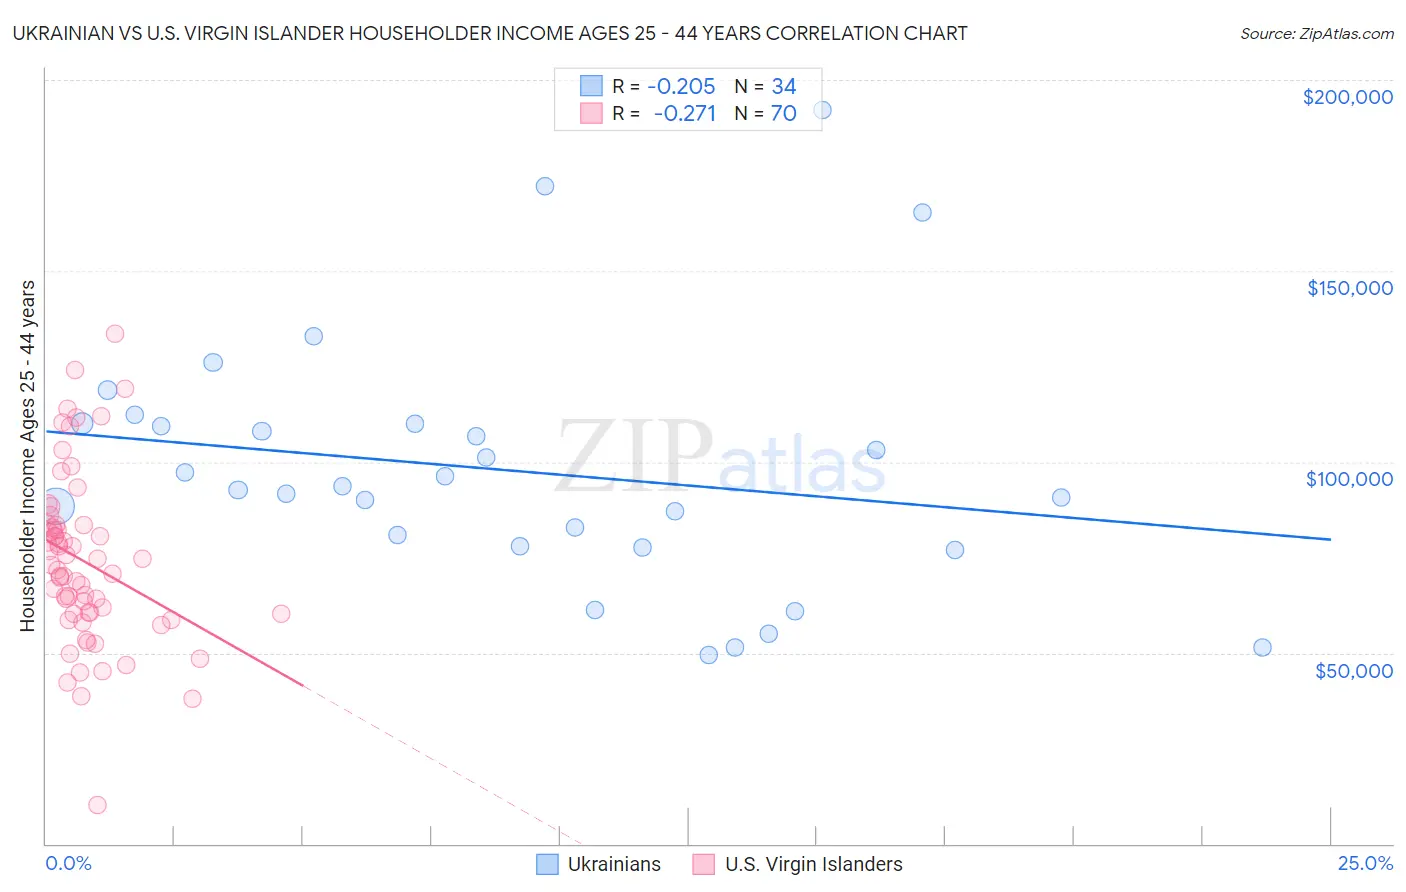
Ukrainian vs U.S. Virgin Islander Householder Income Ages 25 - 44 years Correlation Chart
The statistical analysis conducted on geographies consisting of 446,911,456 people shows a weak negative correlation between the proportion of Ukrainians and household income with householder between the ages 25 and 44 in the United States with a correlation coefficient (R) of -0.205 and weighted average of $102,451. Similarly, the statistical analysis conducted on geographies consisting of 87,500,789 people shows a weak negative correlation between the proportion of U.S. Virgin Islanders and household income with householder between the ages 25 and 44 in the United States with a correlation coefficient (R) of -0.271 and weighted average of $78,911, a difference of 29.8%.
Householder Income Ages 25 - 44 years Correlation Summary
| Measurement | Ukrainian | U.S. Virgin Islander |
| Minimum | $49,533 | $10,066 |
| Maximum | $192,200 | $133,704 |
| Range | $142,666 | $123,638 |
| Mean | $97,681 | $73,982 |
| Median | $93,249 | $72,367 |
| Interquartile 25% (IQ1) | $77,819 | $60,369 |
| Interquartile 75% (IQ3) | $109,920 | $83,425 |
| Interquartile Range (IQR) | $32,101 | $23,056 |
| Standard Deviation (Sample) | $32,854 | $22,240 |
| Standard Deviation (Population) | $32,367 | $22,080 |
Similar Demographics by Householder Income Ages 25 - 44 years
Demographics Similar to Ukrainians by Householder Income Ages 25 - 44 years
In terms of householder income ages 25 - 44 years, the demographic groups most similar to Ukrainians are Croatian ($102,414, a difference of 0.040%), Immigrants from North America ($102,407, a difference of 0.040%), Romanian ($102,544, a difference of 0.090%), Immigrants from Canada ($102,616, a difference of 0.16%), and Immigrants from Hungary ($102,655, a difference of 0.20%).
| Demographics | Rating | Rank | Householder Income Ages 25 - 44 years |
| Argentineans | 99.1 /100 | #83 | Exceptional $103,111 |
| Immigrants | Philippines | 99.0 /100 | #84 | Exceptional $102,910 |
| Immigrants | Ukraine | 98.9 /100 | #85 | Exceptional $102,664 |
| Immigrants | Hungary | 98.9 /100 | #86 | Exceptional $102,655 |
| Immigrants | Western Europe | 98.9 /100 | #87 | Exceptional $102,654 |
| Immigrants | Canada | 98.9 /100 | #88 | Exceptional $102,616 |
| Romanians | 98.8 /100 | #89 | Exceptional $102,544 |
| Ukrainians | 98.8 /100 | #90 | Exceptional $102,451 |
| Croatians | 98.7 /100 | #91 | Exceptional $102,414 |
| Immigrants | North America | 98.7 /100 | #92 | Exceptional $102,407 |
| Immigrants | England | 98.4 /100 | #93 | Exceptional $102,020 |
| Sri Lankans | 98.4 /100 | #94 | Exceptional $101,960 |
| Assyrians/Chaldeans/Syriacs | 98.3 /100 | #95 | Exceptional $101,936 |
| Macedonians | 98.3 /100 | #96 | Exceptional $101,882 |
| Austrians | 98.3 /100 | #97 | Exceptional $101,842 |
Demographics Similar to U.S. Virgin Islanders by Householder Income Ages 25 - 44 years
In terms of householder income ages 25 - 44 years, the demographic groups most similar to U.S. Virgin Islanders are African ($78,986, a difference of 0.090%), Ottawa ($79,012, a difference of 0.13%), Immigrants from Mexico ($78,809, a difference of 0.13%), Cheyenne ($79,152, a difference of 0.30%), and Honduran ($78,540, a difference of 0.47%).
| Demographics | Rating | Rank | Householder Income Ages 25 - 44 years |
| Fijians | 0.0 /100 | #310 | Tragic $79,956 |
| Indonesians | 0.0 /100 | #311 | Tragic $79,543 |
| Immigrants | Haiti | 0.0 /100 | #312 | Tragic $79,391 |
| Menominee | 0.0 /100 | #313 | Tragic $79,358 |
| Cheyenne | 0.0 /100 | #314 | Tragic $79,152 |
| Ottawa | 0.0 /100 | #315 | Tragic $79,012 |
| Africans | 0.0 /100 | #316 | Tragic $78,986 |
| U.S. Virgin Islanders | 0.0 /100 | #317 | Tragic $78,911 |
| Immigrants | Mexico | 0.0 /100 | #318 | Tragic $78,809 |
| Hondurans | 0.0 /100 | #319 | Tragic $78,540 |
| Choctaw | 0.0 /100 | #320 | Tragic $78,168 |
| Immigrants | Zaire | 0.0 /100 | #321 | Tragic $78,045 |
| Chickasaw | 0.0 /100 | #322 | Tragic $77,929 |
| Immigrants | Honduras | 0.0 /100 | #323 | Tragic $77,328 |
| Dutch West Indians | 0.0 /100 | #324 | Tragic $77,260 |