Hispanic or Latino vs U.S. Virgin Islander Kindergarten
COMPARE
Hispanic or Latino
U.S. Virgin Islander
Kindergarten
Kindergarten Comparison
Hispanics or Latinos
U.S. Virgin Islanders
97.0%
KINDERGARTEN
0.0/ 100
METRIC RATING
307th/ 347
METRIC RANK
97.6%
KINDERGARTEN
1.7/ 100
METRIC RATING
239th/ 347
METRIC RANK
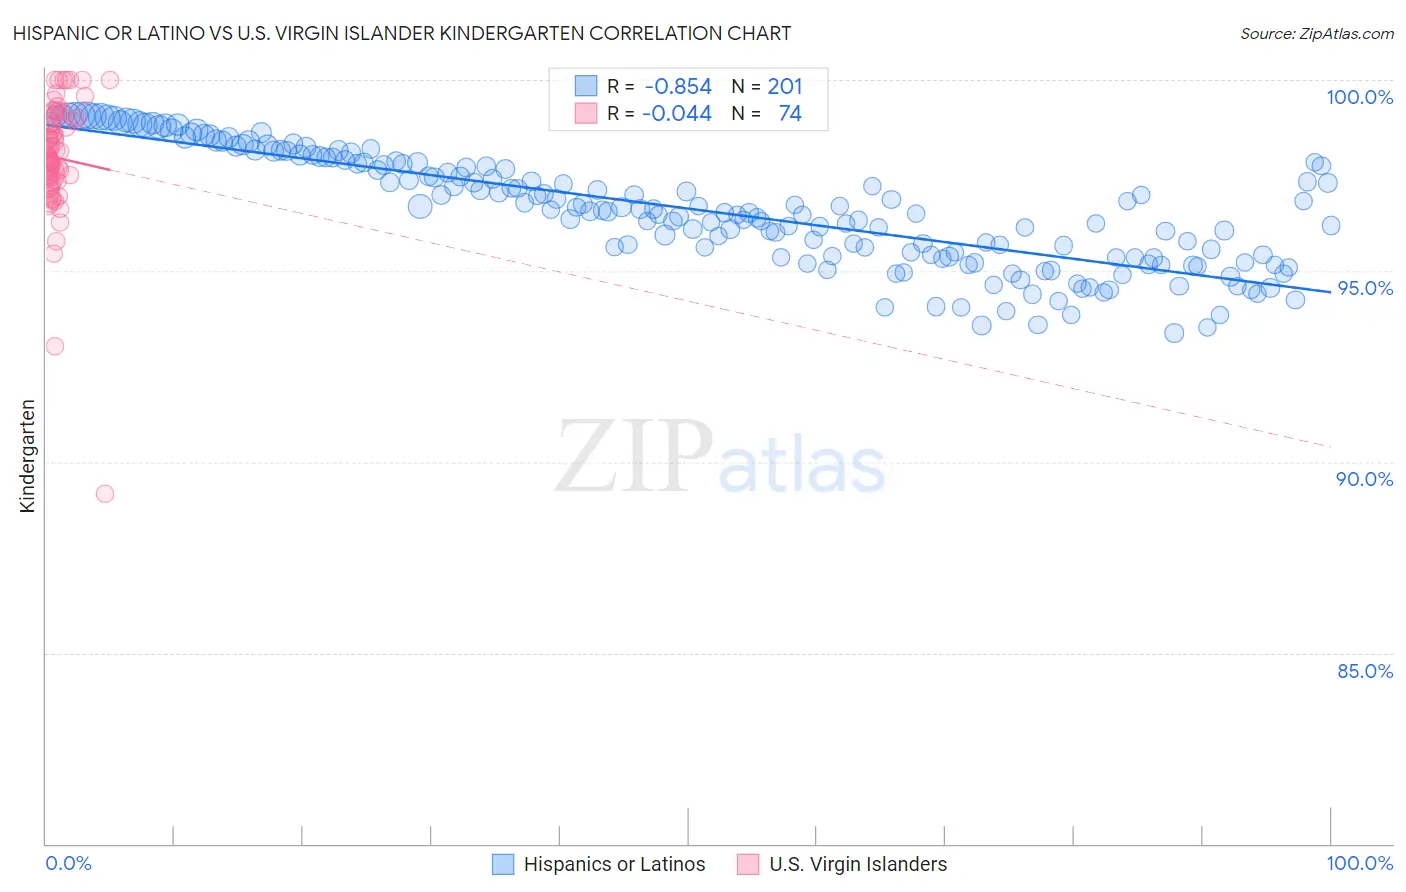
Hispanic or Latino vs U.S. Virgin Islander Kindergarten Correlation Chart
The statistical analysis conducted on geographies consisting of 578,615,396 people shows a very strong negative correlation between the proportion of Hispanics or Latinos and percentage of population with at least kindergarten education in the United States with a correlation coefficient (R) of -0.854 and weighted average of 97.0%. Similarly, the statistical analysis conducted on geographies consisting of 87,529,315 people shows no correlation between the proportion of U.S. Virgin Islanders and percentage of population with at least kindergarten education in the United States with a correlation coefficient (R) of -0.044 and weighted average of 97.6%, a difference of 0.69%.
Kindergarten Correlation Summary
| Measurement | Hispanic or Latino | U.S. Virgin Islander |
| Minimum | 93.4% | 89.2% |
| Maximum | 99.1% | 100.0% |
| Range | 5.7% | 10.8% |
| Mean | 96.6% | 98.0% |
| Median | 96.6% | 98.0% |
| Interquartile 25% (IQ1) | 95.4% | 97.5% |
| Interquartile 75% (IQ3) | 97.9% | 98.9% |
| Interquartile Range (IQR) | 2.5% | 1.5% |
| Standard Deviation (Sample) | 1.5% | 1.6% |
| Standard Deviation (Population) | 1.5% | 1.6% |
Similar Demographics by Kindergarten
Demographics Similar to Hispanics or Latinos by Kindergarten
In terms of kindergarten, the demographic groups most similar to Hispanics or Latinos are Belizean (97.0%, a difference of 0.010%), Immigrants from Somalia (97.0%, a difference of 0.010%), Immigrants from Haiti (97.0%, a difference of 0.010%), Immigrants from the Azores (97.0%, a difference of 0.020%), and Sri Lankan (97.0%, a difference of 0.020%).
| Demographics | Rating | Rank | Kindergarten |
| Haitians | 0.0 /100 | #300 | Tragic 97.1% |
| Immigrants | South Eastern Asia | 0.0 /100 | #301 | Tragic 97.1% |
| Immigrants | Caribbean | 0.0 /100 | #302 | Tragic 97.1% |
| Somalis | 0.0 /100 | #303 | Tragic 97.0% |
| Nicaraguans | 0.0 /100 | #304 | Tragic 97.0% |
| Ecuadorians | 0.0 /100 | #305 | Tragic 97.0% |
| Belizeans | 0.0 /100 | #306 | Tragic 97.0% |
| Hispanics or Latinos | 0.0 /100 | #307 | Tragic 97.0% |
| Immigrants | Somalia | 0.0 /100 | #308 | Tragic 97.0% |
| Immigrants | Haiti | 0.0 /100 | #309 | Tragic 97.0% |
| Immigrants | Azores | 0.0 /100 | #310 | Tragic 97.0% |
| Sri Lankans | 0.0 /100 | #311 | Tragic 97.0% |
| Guyanese | 0.0 /100 | #312 | Tragic 96.9% |
| Cape Verdeans | 0.0 /100 | #313 | Tragic 96.9% |
| Hondurans | 0.0 /100 | #314 | Tragic 96.9% |
Demographics Similar to U.S. Virgin Islanders by Kindergarten
In terms of kindergarten, the demographic groups most similar to U.S. Virgin Islanders are Nigerian (97.6%, a difference of 0.0%), Immigrants from Eastern Asia (97.6%, a difference of 0.0%), Korean (97.6%, a difference of 0.010%), Immigrants from Pakistan (97.7%, a difference of 0.020%), and Immigrants from Malaysia (97.7%, a difference of 0.020%).
| Demographics | Rating | Rank | Kindergarten |
| Immigrants | Uruguay | 2.6 /100 | #232 | Tragic 97.7% |
| Immigrants | Pakistan | 2.2 /100 | #233 | Tragic 97.7% |
| Immigrants | Malaysia | 2.2 /100 | #234 | Tragic 97.7% |
| Colombians | 2.2 /100 | #235 | Tragic 97.7% |
| Immigrants | Western Asia | 2.1 /100 | #236 | Tragic 97.7% |
| Nigerians | 1.8 /100 | #237 | Tragic 97.6% |
| Immigrants | Eastern Asia | 1.7 /100 | #238 | Tragic 97.6% |
| U.S. Virgin Islanders | 1.7 /100 | #239 | Tragic 97.6% |
| Koreans | 1.6 /100 | #240 | Tragic 97.6% |
| Liberians | 1.3 /100 | #241 | Tragic 97.6% |
| Immigrants | Indonesia | 1.3 /100 | #242 | Tragic 97.6% |
| Asians | 1.2 /100 | #243 | Tragic 97.6% |
| Bolivians | 1.2 /100 | #244 | Tragic 97.6% |
| South Americans | 1.1 /100 | #245 | Tragic 97.6% |
| Indians (Asian) | 1.0 /100 | #246 | Tragic 97.6% |