Immigrants from Romania vs U.S. Virgin Islander Householder Income Ages 25 - 44 years
COMPARE
Immigrants from Romania
U.S. Virgin Islander
Householder Income Ages 25 - 44 years
Householder Income Ages 25 - 44 years Comparison
Immigrants from Romania
U.S. Virgin Islanders
$104,713
HOUSEHOLDER INCOME AGES 25 - 44 YEARS
99.6/ 100
METRIC RATING
67th/ 347
METRIC RANK
$78,911
HOUSEHOLDER INCOME AGES 25 - 44 YEARS
0.0/ 100
METRIC RATING
317th/ 347
METRIC RANK
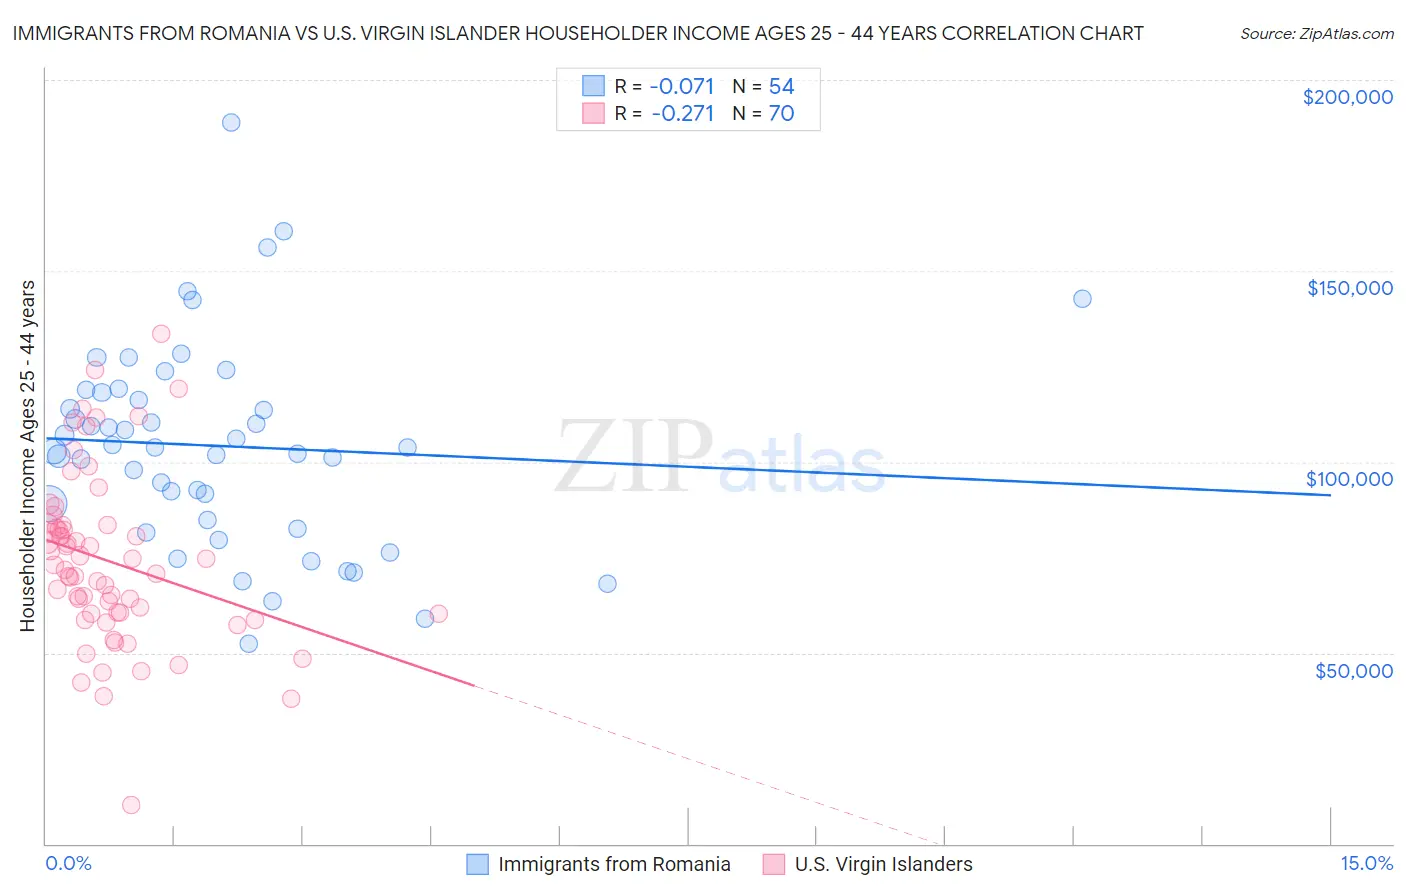
Immigrants from Romania vs U.S. Virgin Islander Householder Income Ages 25 - 44 years Correlation Chart
The statistical analysis conducted on geographies consisting of 256,633,745 people shows a slight negative correlation between the proportion of Immigrants from Romania and household income with householder between the ages 25 and 44 in the United States with a correlation coefficient (R) of -0.071 and weighted average of $104,713. Similarly, the statistical analysis conducted on geographies consisting of 87,500,789 people shows a weak negative correlation between the proportion of U.S. Virgin Islanders and household income with householder between the ages 25 and 44 in the United States with a correlation coefficient (R) of -0.271 and weighted average of $78,911, a difference of 32.7%.
Householder Income Ages 25 - 44 years Correlation Summary
| Measurement | Immigrants from Romania | U.S. Virgin Islander |
| Minimum | $52,260 | $10,066 |
| Maximum | $188,943 | $133,704 |
| Range | $136,683 | $123,638 |
| Mean | $104,157 | $73,982 |
| Median | $103,726 | $72,367 |
| Interquartile 25% (IQ1) | $84,716 | $60,369 |
| Interquartile 75% (IQ3) | $118,244 | $83,425 |
| Interquartile Range (IQR) | $33,528 | $23,056 |
| Standard Deviation (Sample) | $26,678 | $22,240 |
| Standard Deviation (Population) | $26,430 | $22,080 |
Similar Demographics by Householder Income Ages 25 - 44 years
Demographics Similar to Immigrants from Romania by Householder Income Ages 25 - 44 years
In terms of householder income ages 25 - 44 years, the demographic groups most similar to Immigrants from Romania are Immigrants from Eastern Europe ($104,662, a difference of 0.050%), Mongolian ($104,578, a difference of 0.13%), Immigrants from Croatia ($104,503, a difference of 0.20%), Laotian ($104,993, a difference of 0.27%), and Afghan ($104,410, a difference of 0.29%).
| Demographics | Rating | Rank | Householder Income Ages 25 - 44 years |
| Egyptians | 99.7 /100 | #60 | Exceptional $105,282 |
| Lithuanians | 99.7 /100 | #61 | Exceptional $105,223 |
| Immigrants | Italy | 99.7 /100 | #62 | Exceptional $105,201 |
| Immigrants | Scotland | 99.7 /100 | #63 | Exceptional $105,089 |
| New Zealanders | 99.7 /100 | #64 | Exceptional $105,085 |
| Immigrants | Netherlands | 99.7 /100 | #65 | Exceptional $105,082 |
| Laotians | 99.7 /100 | #66 | Exceptional $104,993 |
| Immigrants | Romania | 99.6 /100 | #67 | Exceptional $104,713 |
| Immigrants | Eastern Europe | 99.6 /100 | #68 | Exceptional $104,662 |
| Mongolians | 99.6 /100 | #69 | Exceptional $104,578 |
| Immigrants | Croatia | 99.6 /100 | #70 | Exceptional $104,503 |
| Afghans | 99.6 /100 | #71 | Exceptional $104,410 |
| Chinese | 99.5 /100 | #72 | Exceptional $104,264 |
| Italians | 99.5 /100 | #73 | Exceptional $104,215 |
| Immigrants | Fiji | 99.5 /100 | #74 | Exceptional $103,954 |
Demographics Similar to U.S. Virgin Islanders by Householder Income Ages 25 - 44 years
In terms of householder income ages 25 - 44 years, the demographic groups most similar to U.S. Virgin Islanders are African ($78,986, a difference of 0.090%), Ottawa ($79,012, a difference of 0.13%), Immigrants from Mexico ($78,809, a difference of 0.13%), Cheyenne ($79,152, a difference of 0.30%), and Honduran ($78,540, a difference of 0.47%).
| Demographics | Rating | Rank | Householder Income Ages 25 - 44 years |
| Fijians | 0.0 /100 | #310 | Tragic $79,956 |
| Indonesians | 0.0 /100 | #311 | Tragic $79,543 |
| Immigrants | Haiti | 0.0 /100 | #312 | Tragic $79,391 |
| Menominee | 0.0 /100 | #313 | Tragic $79,358 |
| Cheyenne | 0.0 /100 | #314 | Tragic $79,152 |
| Ottawa | 0.0 /100 | #315 | Tragic $79,012 |
| Africans | 0.0 /100 | #316 | Tragic $78,986 |
| U.S. Virgin Islanders | 0.0 /100 | #317 | Tragic $78,911 |
| Immigrants | Mexico | 0.0 /100 | #318 | Tragic $78,809 |
| Hondurans | 0.0 /100 | #319 | Tragic $78,540 |
| Choctaw | 0.0 /100 | #320 | Tragic $78,168 |
| Immigrants | Zaire | 0.0 /100 | #321 | Tragic $78,045 |
| Chickasaw | 0.0 /100 | #322 | Tragic $77,929 |
| Immigrants | Honduras | 0.0 /100 | #323 | Tragic $77,328 |
| Dutch West Indians | 0.0 /100 | #324 | Tragic $77,260 |