Immigrants from Singapore vs Bangladeshi Median Earnings
COMPARE
Immigrants from Singapore
Bangladeshi
Median Earnings
Median Earnings Comparison
Immigrants from Singapore
Bangladeshis
$59,038
MEDIAN EARNINGS
100.0/ 100
METRIC RATING
6th/ 347
METRIC RANK
$41,263
MEDIAN EARNINGS
0.1/ 100
METRIC RATING
295th/ 347
METRIC RANK
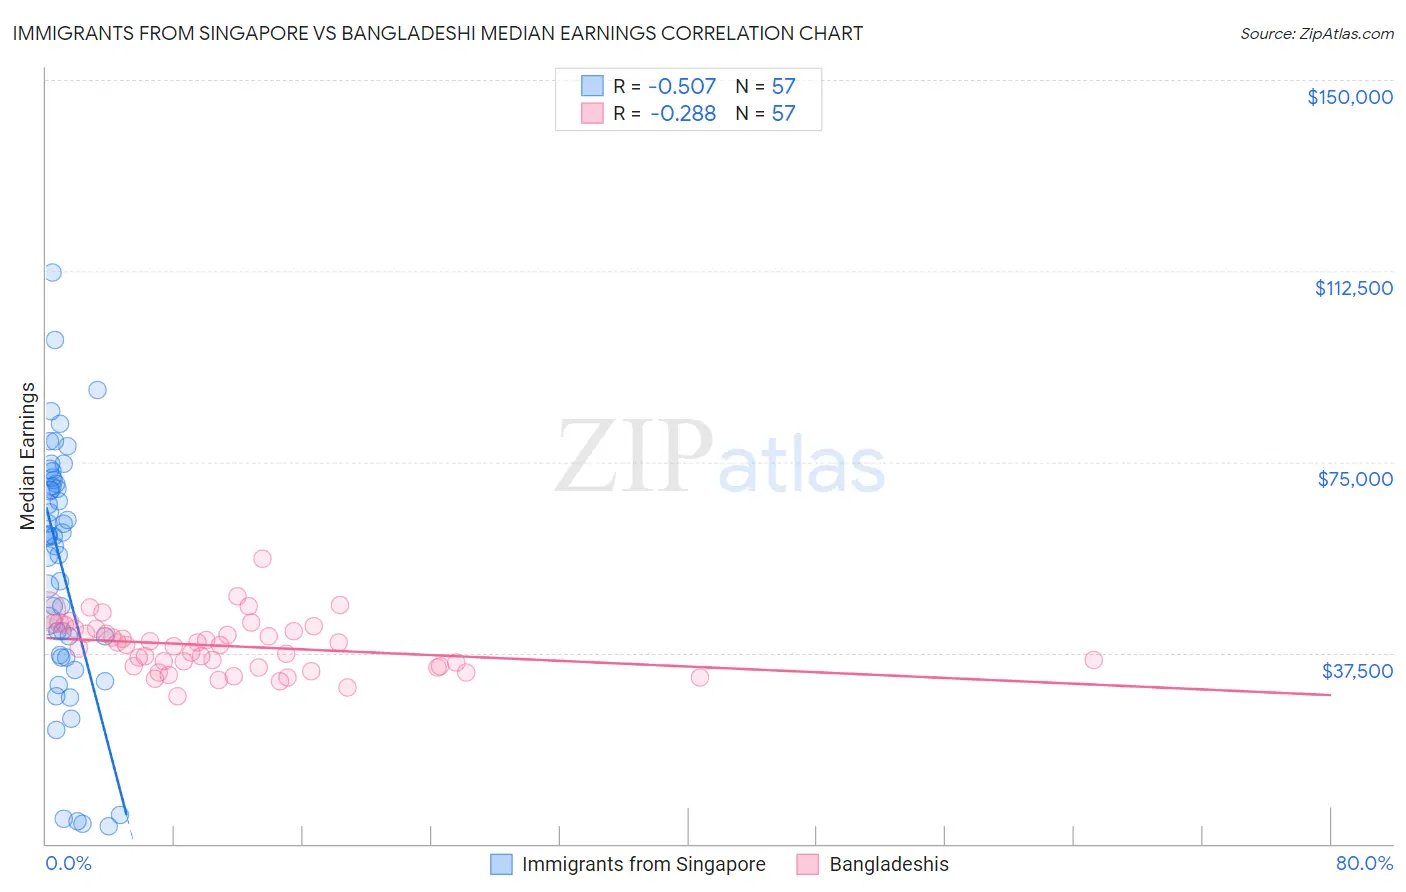
Immigrants from Singapore vs Bangladeshi Median Earnings Correlation Chart
The statistical analysis conducted on geographies consisting of 137,505,488 people shows a substantial negative correlation between the proportion of Immigrants from Singapore and median earnings in the United States with a correlation coefficient (R) of -0.507 and weighted average of $59,038. Similarly, the statistical analysis conducted on geographies consisting of 141,452,923 people shows a weak negative correlation between the proportion of Bangladeshis and median earnings in the United States with a correlation coefficient (R) of -0.288 and weighted average of $41,263, a difference of 43.1%.
Median Earnings Correlation Summary
| Measurement | Immigrants from Singapore | Bangladeshi |
| Minimum | $3,412 | $28,992 |
| Maximum | $112,087 | $55,893 |
| Range | $108,675 | $26,901 |
| Mean | $54,277 | $38,826 |
| Median | $60,355 | $38,964 |
| Interquartile 25% (IQ1) | $36,759 | $34,688 |
| Interquartile 75% (IQ3) | $71,145 | $42,288 |
| Interquartile Range (IQR) | $34,386 | $7,600 |
| Standard Deviation (Sample) | $24,368 | $5,171 |
| Standard Deviation (Population) | $24,153 | $5,125 |
Similar Demographics by Median Earnings
Demographics Similar to Immigrants from Singapore by Median Earnings
In terms of median earnings, the demographic groups most similar to Immigrants from Singapore are Thai ($59,237, a difference of 0.34%), Immigrants from Hong Kong ($59,433, a difference of 0.67%), Iranian ($58,474, a difference of 0.97%), Immigrants from Iran ($57,612, a difference of 2.5%), and Okinawan ($57,550, a difference of 2.6%).
| Demographics | Rating | Rank | Median Earnings |
| Filipinos | 100.0 /100 | #1 | Exceptional $61,197 |
| Immigrants | Taiwan | 100.0 /100 | #2 | Exceptional $61,151 |
| Immigrants | India | 100.0 /100 | #3 | Exceptional $60,648 |
| Immigrants | Hong Kong | 100.0 /100 | #4 | Exceptional $59,433 |
| Thais | 100.0 /100 | #5 | Exceptional $59,237 |
| Immigrants | Singapore | 100.0 /100 | #6 | Exceptional $59,038 |
| Iranians | 100.0 /100 | #7 | Exceptional $58,474 |
| Immigrants | Iran | 100.0 /100 | #8 | Exceptional $57,612 |
| Okinawans | 100.0 /100 | #9 | Exceptional $57,550 |
| Immigrants | South Central Asia | 100.0 /100 | #10 | Exceptional $57,114 |
| Immigrants | Israel | 100.0 /100 | #11 | Exceptional $57,034 |
| Immigrants | Ireland | 100.0 /100 | #12 | Exceptional $56,854 |
| Immigrants | China | 100.0 /100 | #13 | Exceptional $56,638 |
| Immigrants | Australia | 100.0 /100 | #14 | Exceptional $56,305 |
| Indians (Asian) | 100.0 /100 | #15 | Exceptional $56,253 |
Demographics Similar to Bangladeshis by Median Earnings
In terms of median earnings, the demographic groups most similar to Bangladeshis are Cherokee ($41,252, a difference of 0.030%), Potawatomi ($41,288, a difference of 0.060%), Guatemalan ($41,205, a difference of 0.14%), Immigrants from Zaire ($41,325, a difference of 0.15%), and Immigrants from Micronesia ($41,133, a difference of 0.32%).
| Demographics | Rating | Rank | Median Earnings |
| Immigrants | Dominican Republic | 0.1 /100 | #288 | Tragic $41,554 |
| Comanche | 0.1 /100 | #289 | Tragic $41,519 |
| Paiute | 0.1 /100 | #290 | Tragic $41,508 |
| Central American Indians | 0.1 /100 | #291 | Tragic $41,474 |
| U.S. Virgin Islanders | 0.1 /100 | #292 | Tragic $41,448 |
| Immigrants | Zaire | 0.1 /100 | #293 | Tragic $41,325 |
| Potawatomi | 0.1 /100 | #294 | Tragic $41,288 |
| Bangladeshis | 0.1 /100 | #295 | Tragic $41,263 |
| Cherokee | 0.1 /100 | #296 | Tragic $41,252 |
| Guatemalans | 0.1 /100 | #297 | Tragic $41,205 |
| Immigrants | Micronesia | 0.1 /100 | #298 | Tragic $41,133 |
| Immigrants | Caribbean | 0.1 /100 | #299 | Tragic $41,119 |
| Ute | 0.1 /100 | #300 | Tragic $41,051 |
| Immigrants | Latin America | 0.1 /100 | #301 | Tragic $41,049 |
| Shoshone | 0.0 /100 | #302 | Tragic $40,932 |