Immigrants from Chile vs Bangladeshi Median Earnings
COMPARE
Immigrants from Chile
Bangladeshi
Median Earnings
Median Earnings Comparison
Immigrants from Chile
Bangladeshis
$47,697
MEDIAN EARNINGS
85.5/ 100
METRIC RATING
146th/ 347
METRIC RANK
$41,263
MEDIAN EARNINGS
0.1/ 100
METRIC RATING
295th/ 347
METRIC RANK
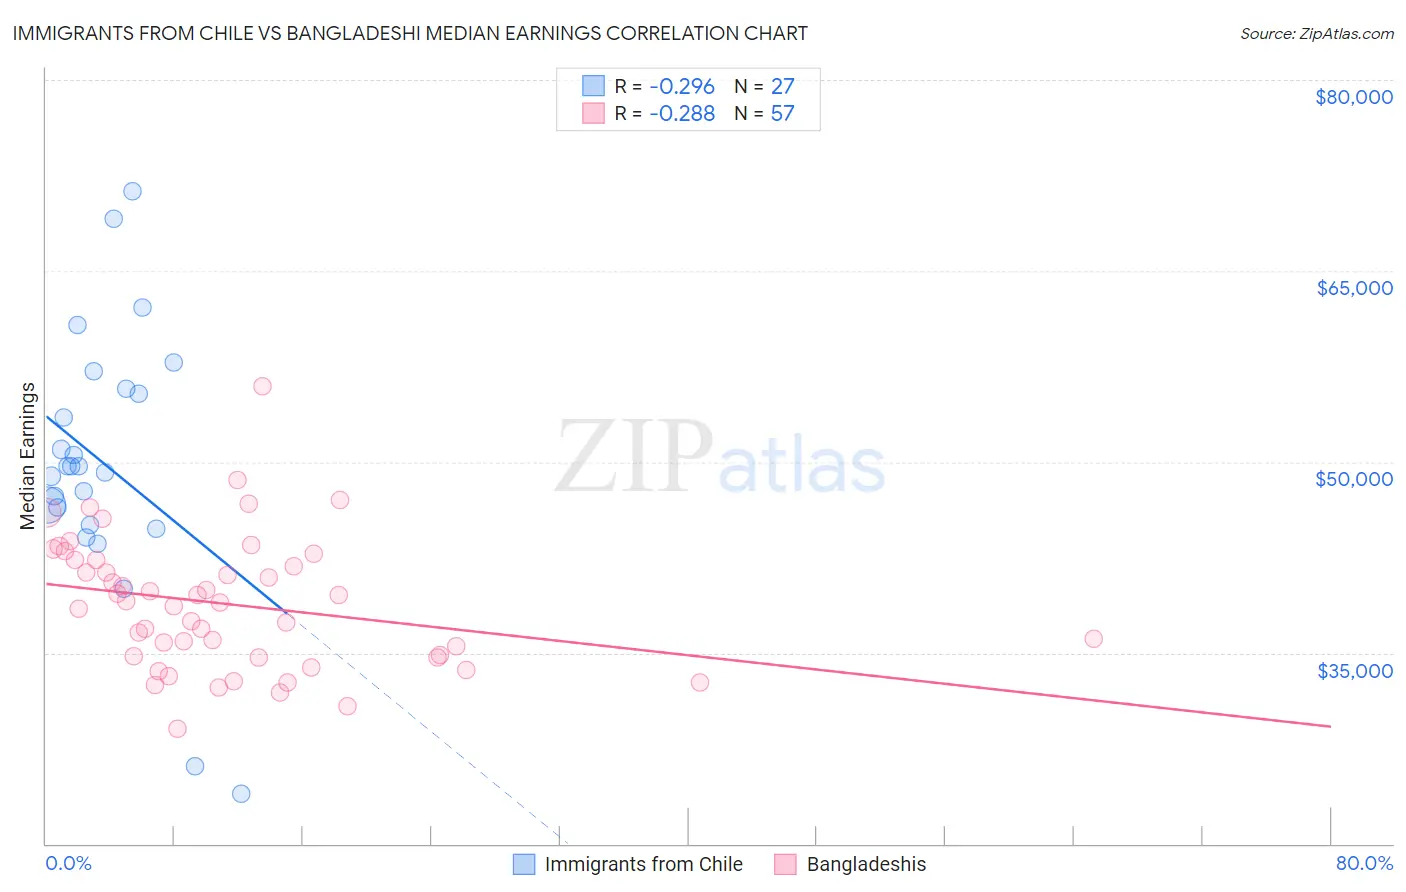
Immigrants from Chile vs Bangladeshi Median Earnings Correlation Chart
The statistical analysis conducted on geographies consisting of 218,645,469 people shows a weak negative correlation between the proportion of Immigrants from Chile and median earnings in the United States with a correlation coefficient (R) of -0.296 and weighted average of $47,697. Similarly, the statistical analysis conducted on geographies consisting of 141,452,923 people shows a weak negative correlation between the proportion of Bangladeshis and median earnings in the United States with a correlation coefficient (R) of -0.288 and weighted average of $41,263, a difference of 15.6%.
Median Earnings Correlation Summary
| Measurement | Immigrants from Chile | Bangladeshi |
| Minimum | $23,911 | $28,992 |
| Maximum | $71,250 | $55,893 |
| Range | $47,339 | $26,901 |
| Mean | $49,886 | $38,826 |
| Median | $49,642 | $38,964 |
| Interquartile 25% (IQ1) | $45,024 | $34,688 |
| Interquartile 75% (IQ3) | $55,791 | $42,288 |
| Interquartile Range (IQR) | $10,767 | $7,600 |
| Standard Deviation (Sample) | $10,356 | $5,171 |
| Standard Deviation (Population) | $10,162 | $5,125 |
Similar Demographics by Median Earnings
Demographics Similar to Immigrants from Chile by Median Earnings
In terms of median earnings, the demographic groups most similar to Immigrants from Chile are Immigrants from Saudi Arabia ($47,704, a difference of 0.010%), Immigrants from South Eastern Asia ($47,671, a difference of 0.060%), Immigrants from Eritrea ($47,657, a difference of 0.080%), Luxembourger ($47,640, a difference of 0.12%), and Peruvian ($47,628, a difference of 0.15%).
| Demographics | Rating | Rank | Median Earnings |
| Canadians | 88.8 /100 | #139 | Excellent $47,911 |
| Taiwanese | 88.7 /100 | #140 | Excellent $47,902 |
| Immigrants | Sierra Leone | 88.3 /100 | #141 | Excellent $47,875 |
| Ugandans | 88.0 /100 | #142 | Excellent $47,854 |
| Swedes | 88.0 /100 | #143 | Excellent $47,851 |
| Hungarians | 87.1 /100 | #144 | Excellent $47,795 |
| Immigrants | Saudi Arabia | 85.6 /100 | #145 | Excellent $47,704 |
| Immigrants | Chile | 85.5 /100 | #146 | Excellent $47,697 |
| Immigrants | South Eastern Asia | 85.0 /100 | #147 | Excellent $47,671 |
| Immigrants | Eritrea | 84.8 /100 | #148 | Excellent $47,657 |
| Luxembourgers | 84.5 /100 | #149 | Excellent $47,640 |
| Peruvians | 84.2 /100 | #150 | Excellent $47,628 |
| Immigrants | Oceania | 84.1 /100 | #151 | Excellent $47,617 |
| Immigrants | Germany | 83.1 /100 | #152 | Excellent $47,566 |
| Slavs | 81.1 /100 | #153 | Excellent $47,470 |
Demographics Similar to Bangladeshis by Median Earnings
In terms of median earnings, the demographic groups most similar to Bangladeshis are Cherokee ($41,252, a difference of 0.030%), Potawatomi ($41,288, a difference of 0.060%), Guatemalan ($41,205, a difference of 0.14%), Immigrants from Zaire ($41,325, a difference of 0.15%), and Immigrants from Micronesia ($41,133, a difference of 0.32%).
| Demographics | Rating | Rank | Median Earnings |
| Immigrants | Dominican Republic | 0.1 /100 | #288 | Tragic $41,554 |
| Comanche | 0.1 /100 | #289 | Tragic $41,519 |
| Paiute | 0.1 /100 | #290 | Tragic $41,508 |
| Central American Indians | 0.1 /100 | #291 | Tragic $41,474 |
| U.S. Virgin Islanders | 0.1 /100 | #292 | Tragic $41,448 |
| Immigrants | Zaire | 0.1 /100 | #293 | Tragic $41,325 |
| Potawatomi | 0.1 /100 | #294 | Tragic $41,288 |
| Bangladeshis | 0.1 /100 | #295 | Tragic $41,263 |
| Cherokee | 0.1 /100 | #296 | Tragic $41,252 |
| Guatemalans | 0.1 /100 | #297 | Tragic $41,205 |
| Immigrants | Micronesia | 0.1 /100 | #298 | Tragic $41,133 |
| Immigrants | Caribbean | 0.1 /100 | #299 | Tragic $41,119 |
| Ute | 0.1 /100 | #300 | Tragic $41,051 |
| Immigrants | Latin America | 0.1 /100 | #301 | Tragic $41,049 |
| Shoshone | 0.0 /100 | #302 | Tragic $40,932 |