Hispanic or Latino vs Arapaho 3 or more Vehicles in Household
COMPARE
Hispanic or Latino
Arapaho
3 or more Vehicles in Household
3 or more Vehicles in Household Comparison
Hispanics or Latinos
Arapaho
22.4%
3 OR MORE VEHICLES IN HOUSEHOLD
100.0/ 100
METRIC RATING
56th/ 347
METRIC RANK
26.4%
3 OR MORE VEHICLES IN HOUSEHOLD
100.0/ 100
METRIC RATING
4th/ 347
METRIC RANK
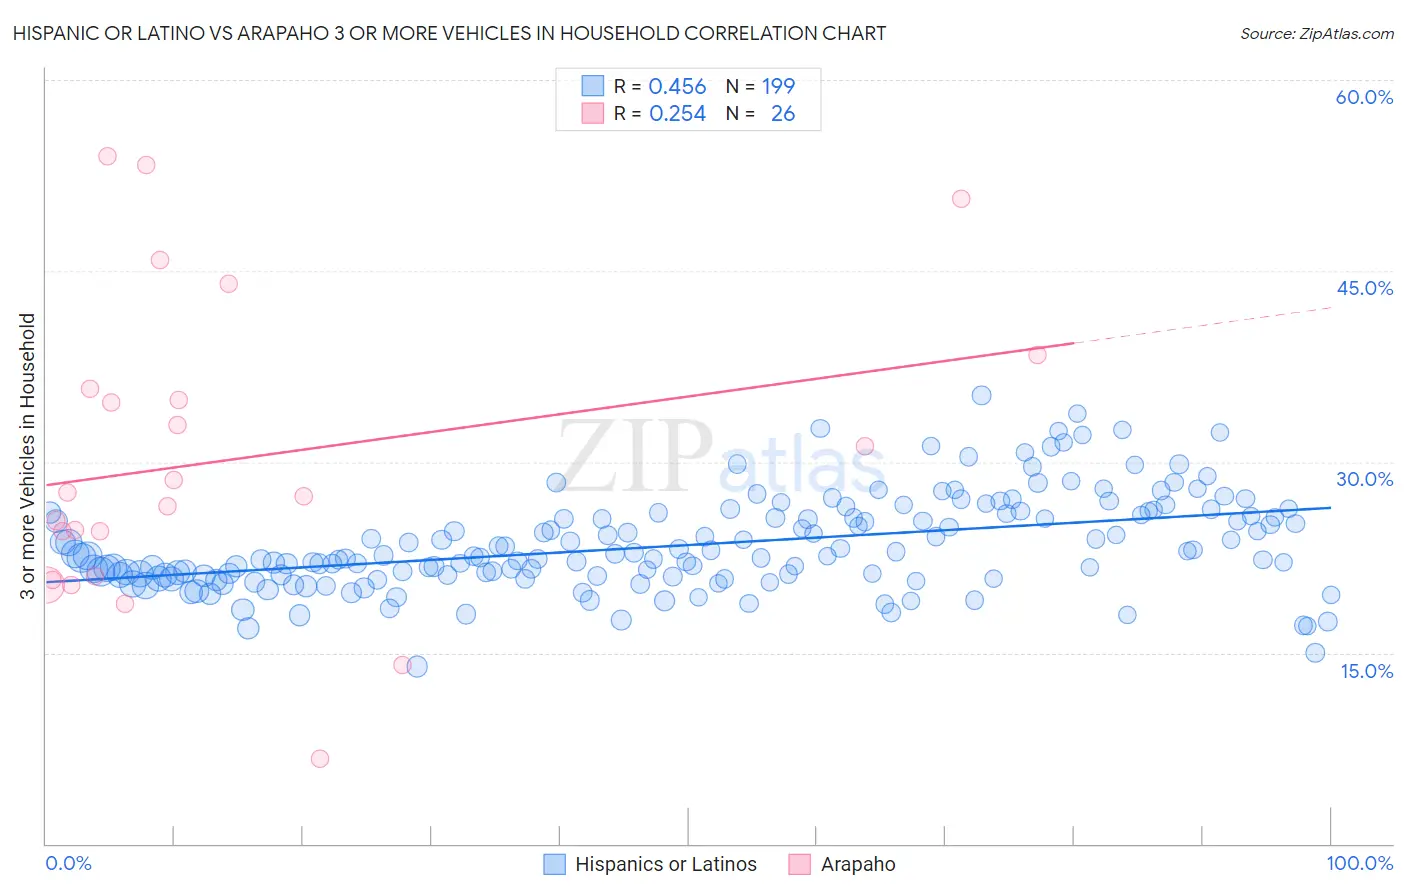
Hispanic or Latino vs Arapaho 3 or more Vehicles in Household Correlation Chart
The statistical analysis conducted on geographies consisting of 563,449,459 people shows a moderate positive correlation between the proportion of Hispanics or Latinos and percentage of households with 3 or more vehicles available in the United States with a correlation coefficient (R) of 0.456 and weighted average of 22.4%. Similarly, the statistical analysis conducted on geographies consisting of 29,776,111 people shows a weak positive correlation between the proportion of Arapaho and percentage of households with 3 or more vehicles available in the United States with a correlation coefficient (R) of 0.254 and weighted average of 26.4%, a difference of 18.2%.
3 or more Vehicles in Household Correlation Summary
| Measurement | Hispanic or Latino | Arapaho |
| Minimum | 13.9% | 6.7% |
| Maximum | 35.2% | 54.0% |
| Range | 21.3% | 47.3% |
| Mean | 23.5% | 30.3% |
| Median | 22.6% | 27.4% |
| Interquartile 25% (IQ1) | 21.1% | 21.0% |
| Interquartile 75% (IQ3) | 25.8% | 35.7% |
| Interquartile Range (IQR) | 4.8% | 14.7% |
| Standard Deviation (Sample) | 3.7% | 11.9% |
| Standard Deviation (Population) | 3.7% | 11.7% |
Similar Demographics by 3 or more Vehicles in Household
Demographics Similar to Hispanics or Latinos by 3 or more Vehicles in Household
In terms of 3 or more vehicles in household, the demographic groups most similar to Hispanics or Latinos are Immigrants from Laos (22.4%, a difference of 0.030%), Pennsylvania German (22.3%, a difference of 0.16%), Spaniard (22.3%, a difference of 0.29%), Navajo (22.3%, a difference of 0.35%), and Crow (22.5%, a difference of 0.40%).
| Demographics | Rating | Rank | 3 or more Vehicles in Household |
| Scotch-Irish | 100.0 /100 | #49 | Exceptional 22.6% |
| Sioux | 100.0 /100 | #50 | Exceptional 22.6% |
| Whites/Caucasians | 100.0 /100 | #51 | Exceptional 22.6% |
| Welsh | 100.0 /100 | #52 | Exceptional 22.6% |
| Czechs | 100.0 /100 | #53 | Exceptional 22.5% |
| Crow | 100.0 /100 | #54 | Exceptional 22.5% |
| Immigrants | Laos | 100.0 /100 | #55 | Exceptional 22.4% |
| Hispanics or Latinos | 100.0 /100 | #56 | Exceptional 22.4% |
| Pennsylvania Germans | 100.0 /100 | #57 | Exceptional 22.3% |
| Spaniards | 100.0 /100 | #58 | Exceptional 22.3% |
| Navajo | 100.0 /100 | #59 | Exceptional 22.3% |
| Finns | 99.9 /100 | #60 | Exceptional 22.3% |
| Bhutanese | 99.9 /100 | #61 | Exceptional 22.2% |
| Fijians | 99.9 /100 | #62 | Exceptional 22.2% |
| Chickasaw | 99.9 /100 | #63 | Exceptional 22.2% |
Demographics Similar to Arapaho by 3 or more Vehicles in Household
In terms of 3 or more vehicles in household, the demographic groups most similar to Arapaho are Tongan (26.5%, a difference of 0.33%), Puget Sound Salish (26.4%, a difference of 0.34%), Immigrants from Fiji (26.1%, a difference of 1.5%), Spanish American Indian (26.9%, a difference of 1.8%), and Colville (25.8%, a difference of 2.7%).
| Demographics | Rating | Rank | 3 or more Vehicles in Household |
| Yakama | 100.0 /100 | #1 | Exceptional 31.0% |
| Spanish American Indians | 100.0 /100 | #2 | Exceptional 26.9% |
| Tongans | 100.0 /100 | #3 | Exceptional 26.5% |
| Arapaho | 100.0 /100 | #4 | Exceptional 26.4% |
| Puget Sound Salish | 100.0 /100 | #5 | Exceptional 26.4% |
| Immigrants | Fiji | 100.0 /100 | #6 | Exceptional 26.1% |
| Colville | 100.0 /100 | #7 | Exceptional 25.8% |
| Samoans | 100.0 /100 | #8 | Exceptional 25.0% |
| Native Hawaiians | 100.0 /100 | #9 | Exceptional 24.9% |
| Nepalese | 100.0 /100 | #10 | Exceptional 24.9% |
| Shoshone | 100.0 /100 | #11 | Exceptional 24.9% |
| Danes | 100.0 /100 | #12 | Exceptional 24.7% |
| Mexicans | 100.0 /100 | #13 | Exceptional 24.7% |
| Immigrants | Mexico | 100.0 /100 | #14 | Exceptional 24.6% |
| Hawaiians | 100.0 /100 | #15 | Exceptional 24.3% |