Ecuadorian vs Arapaho Median Household Income
COMPARE
Ecuadorian
Arapaho
Median Household Income
Median Household Income Comparison
Ecuadorians
Arapaho
$82,070
MEDIAN HOUSEHOLD INCOME
12.5/ 100
METRIC RATING
217th/ 347
METRIC RANK
$67,965
MEDIAN HOUSEHOLD INCOME
0.0/ 100
METRIC RATING
330th/ 347
METRIC RANK
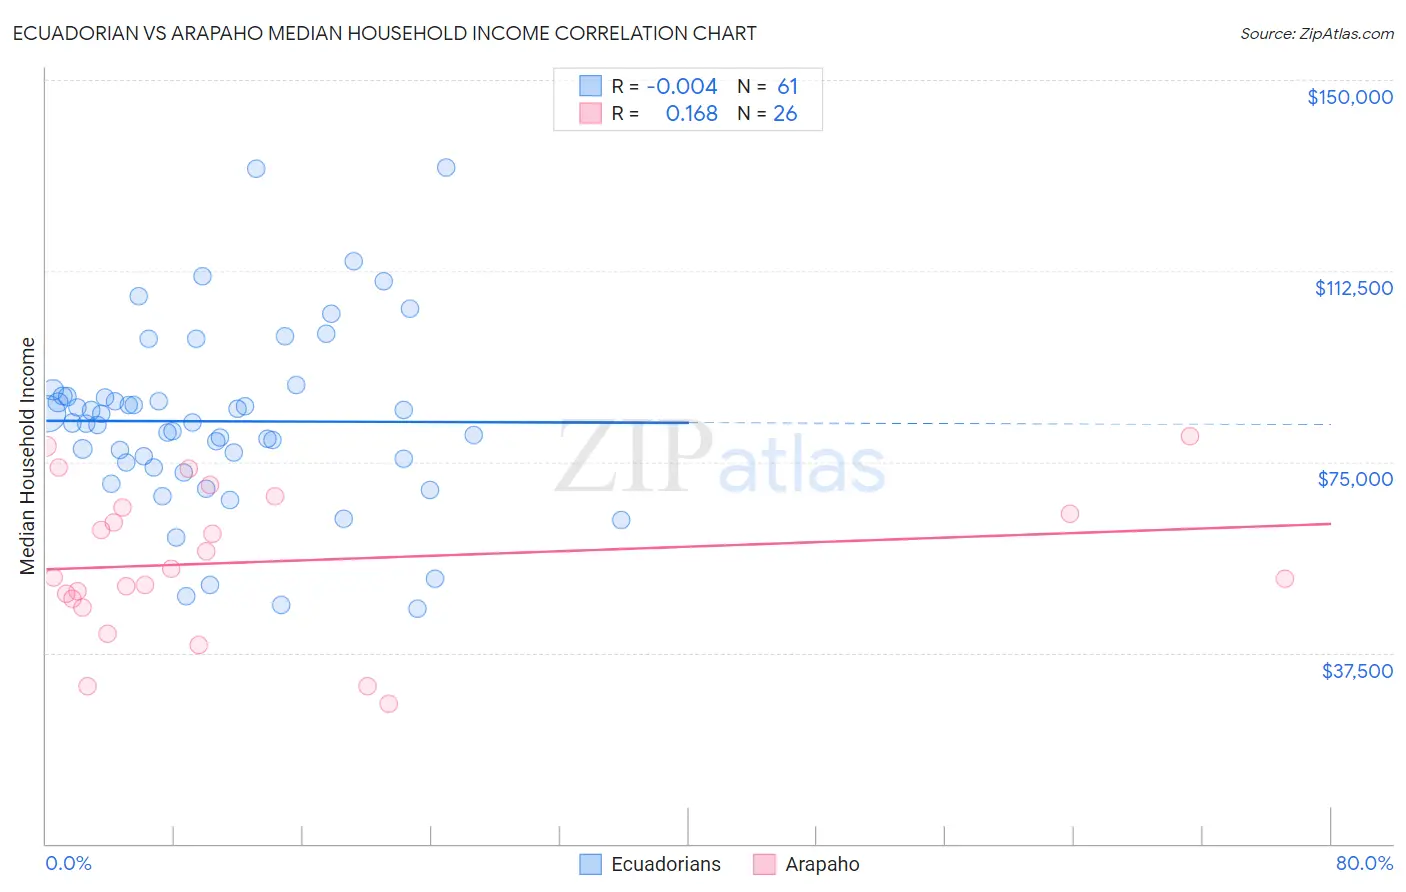
Ecuadorian vs Arapaho Median Household Income Correlation Chart
The statistical analysis conducted on geographies consisting of 317,572,245 people shows no correlation between the proportion of Ecuadorians and median household income in the United States with a correlation coefficient (R) of -0.004 and weighted average of $82,070. Similarly, the statistical analysis conducted on geographies consisting of 29,777,139 people shows a poor positive correlation between the proportion of Arapaho and median household income in the United States with a correlation coefficient (R) of 0.168 and weighted average of $67,965, a difference of 20.7%.
Median Household Income Correlation Summary
| Measurement | Ecuadorian | Arapaho |
| Minimum | $46,188 | $27,500 |
| Maximum | $132,837 | $80,000 |
| Range | $86,649 | $52,500 |
| Mean | $82,960 | $55,430 |
| Median | $82,671 | $53,182 |
| Interquartile 25% (IQ1) | $74,469 | $47,998 |
| Interquartile 75% (IQ3) | $87,872 | $66,111 |
| Interquartile Range (IQR) | $13,403 | $18,113 |
| Standard Deviation (Sample) | $17,786 | $14,479 |
| Standard Deviation (Population) | $17,640 | $14,198 |
Similar Demographics by Median Household Income
Demographics Similar to Ecuadorians by Median Household Income
In terms of median household income, the demographic groups most similar to Ecuadorians are White/Caucasian ($82,029, a difference of 0.050%), Yugoslavian ($82,186, a difference of 0.14%), Vietnamese ($82,248, a difference of 0.22%), Panamanian ($82,272, a difference of 0.25%), and Nepalese ($82,410, a difference of 0.41%).
| Demographics | Rating | Rank | Median Household Income |
| Immigrants | Uruguay | 16.4 /100 | #210 | Poor $82,560 |
| Salvadorans | 15.4 /100 | #211 | Poor $82,449 |
| Venezuelans | 15.3 /100 | #212 | Poor $82,432 |
| Nepalese | 15.1 /100 | #213 | Poor $82,410 |
| Panamanians | 14.0 /100 | #214 | Poor $82,272 |
| Vietnamese | 13.8 /100 | #215 | Poor $82,248 |
| Yugoslavians | 13.3 /100 | #216 | Poor $82,186 |
| Ecuadorians | 12.5 /100 | #217 | Poor $82,070 |
| Whites/Caucasians | 12.2 /100 | #218 | Poor $82,029 |
| Nigerians | 10.3 /100 | #219 | Poor $81,725 |
| Immigrants | Venezuela | 9.0 /100 | #220 | Tragic $81,506 |
| Immigrants | Ghana | 9.0 /100 | #221 | Tragic $81,489 |
| Immigrants | Nigeria | 7.7 /100 | #222 | Tragic $81,236 |
| Immigrants | El Salvador | 7.6 /100 | #223 | Tragic $81,213 |
| Malaysians | 7.0 /100 | #224 | Tragic $81,064 |
Demographics Similar to Arapaho by Median Household Income
In terms of median household income, the demographic groups most similar to Arapaho are Native/Alaskan ($67,879, a difference of 0.13%), Sioux ($67,792, a difference of 0.25%), Creek ($67,715, a difference of 0.37%), Black/African American ($67,573, a difference of 0.58%), and Dutch West Indian ($68,412, a difference of 0.66%).
| Demographics | Rating | Rank | Median Household Income |
| Bahamians | 0.0 /100 | #323 | Tragic $69,726 |
| Yup'ik | 0.0 /100 | #324 | Tragic $69,695 |
| Seminole | 0.0 /100 | #325 | Tragic $69,420 |
| Yuman | 0.0 /100 | #326 | Tragic $68,743 |
| Immigrants | Cuba | 0.0 /100 | #327 | Tragic $68,461 |
| Menominee | 0.0 /100 | #328 | Tragic $68,423 |
| Dutch West Indians | 0.0 /100 | #329 | Tragic $68,412 |
| Arapaho | 0.0 /100 | #330 | Tragic $67,965 |
| Natives/Alaskans | 0.0 /100 | #331 | Tragic $67,879 |
| Sioux | 0.0 /100 | #332 | Tragic $67,792 |
| Creek | 0.0 /100 | #333 | Tragic $67,715 |
| Blacks/African Americans | 0.0 /100 | #334 | Tragic $67,573 |
| Cheyenne | 0.0 /100 | #335 | Tragic $66,974 |
| Immigrants | Congo | 0.0 /100 | #336 | Tragic $66,768 |
| Kiowa | 0.0 /100 | #337 | Tragic $65,914 |