Hawaiian vs Immigrants from Egypt Median Female Earnings
COMPARE
Hawaiian
Immigrants from Egypt
Median Female Earnings
Median Female Earnings Comparison
Hawaiians
Immigrants from Egypt
$37,497
MEDIAN FEMALE EARNINGS
1.0/ 100
METRIC RATING
257th/ 347
METRIC RANK
$42,837
MEDIAN FEMALE EARNINGS
99.9/ 100
METRIC RATING
67th/ 347
METRIC RANK
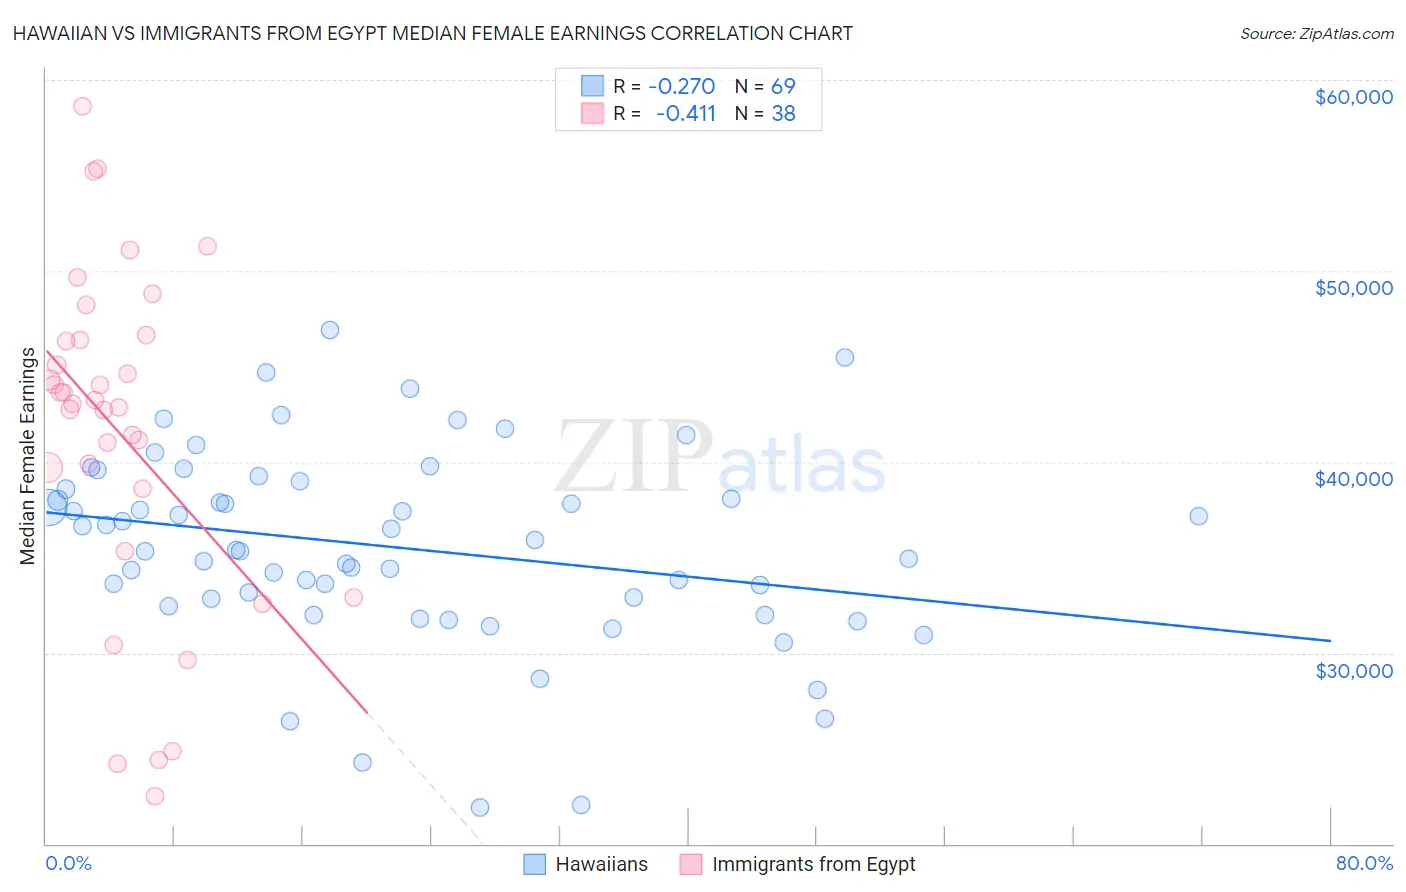
Hawaiian vs Immigrants from Egypt Median Female Earnings Correlation Chart
The statistical analysis conducted on geographies consisting of 327,459,895 people shows a weak negative correlation between the proportion of Hawaiians and median female earnings in the United States with a correlation coefficient (R) of -0.270 and weighted average of $37,497. Similarly, the statistical analysis conducted on geographies consisting of 245,465,633 people shows a moderate negative correlation between the proportion of Immigrants from Egypt and median female earnings in the United States with a correlation coefficient (R) of -0.411 and weighted average of $42,837, a difference of 14.2%.
Median Female Earnings Correlation Summary
| Measurement | Hawaiian | Immigrants from Egypt |
| Minimum | $21,870 | $22,500 |
| Maximum | $46,893 | $58,618 |
| Range | $25,022 | $36,118 |
| Mean | $35,548 | $41,582 |
| Median | $35,373 | $43,155 |
| Interquartile 25% (IQ1) | $32,654 | $38,571 |
| Interquartile 75% (IQ3) | $38,788 | $46,404 |
| Interquartile Range (IQR) | $6,134 | $7,833 |
| Standard Deviation (Sample) | $5,103 | $8,802 |
| Standard Deviation (Population) | $5,066 | $8,685 |
Similar Demographics by Median Female Earnings
Demographics Similar to Hawaiians by Median Female Earnings
In terms of median female earnings, the demographic groups most similar to Hawaiians are Samoan ($37,498, a difference of 0.0%), Colville ($37,514, a difference of 0.040%), White/Caucasian ($37,531, a difference of 0.090%), Belizean ($37,429, a difference of 0.18%), and Scotch-Irish ($37,383, a difference of 0.31%).
| Demographics | Rating | Rank | Median Female Earnings |
| Immigrants | Iraq | 2.2 /100 | #250 | Tragic $37,864 |
| Welsh | 2.1 /100 | #251 | Tragic $37,856 |
| Immigrants | Dominica | 2.0 /100 | #252 | Tragic $37,825 |
| Danes | 1.6 /100 | #253 | Tragic $37,730 |
| Whites/Caucasians | 1.1 /100 | #254 | Tragic $37,531 |
| Colville | 1.1 /100 | #255 | Tragic $37,514 |
| Samoans | 1.0 /100 | #256 | Tragic $37,498 |
| Hawaiians | 1.0 /100 | #257 | Tragic $37,497 |
| Belizeans | 0.9 /100 | #258 | Tragic $37,429 |
| Scotch-Irish | 0.8 /100 | #259 | Tragic $37,383 |
| Dutch | 0.7 /100 | #260 | Tragic $37,339 |
| Malaysians | 0.7 /100 | #261 | Tragic $37,298 |
| Venezuelans | 0.7 /100 | #262 | Tragic $37,282 |
| German Russians | 0.5 /100 | #263 | Tragic $37,105 |
| Salvadorans | 0.4 /100 | #264 | Tragic $37,083 |
Demographics Similar to Immigrants from Egypt by Median Female Earnings
In terms of median female earnings, the demographic groups most similar to Immigrants from Egypt are Immigrants from Norway ($42,837, a difference of 0.0%), Immigrants from Austria ($42,824, a difference of 0.030%), Immigrants from Spain ($42,815, a difference of 0.050%), Sierra Leonean ($42,868, a difference of 0.070%), and Immigrants from Ethiopia ($42,744, a difference of 0.22%).
| Demographics | Rating | Rank | Median Female Earnings |
| Immigrants | Latvia | 99.9 /100 | #60 | Exceptional $43,099 |
| Immigrants | Bulgaria | 99.9 /100 | #61 | Exceptional $43,085 |
| Afghans | 99.9 /100 | #62 | Exceptional $43,077 |
| Immigrants | Ukraine | 99.9 /100 | #63 | Exceptional $43,069 |
| Immigrants | Pakistan | 99.9 /100 | #64 | Exceptional $43,052 |
| Sierra Leoneans | 99.9 /100 | #65 | Exceptional $42,868 |
| Immigrants | Norway | 99.9 /100 | #66 | Exceptional $42,837 |
| Immigrants | Egypt | 99.9 /100 | #67 | Exceptional $42,837 |
| Immigrants | Austria | 99.8 /100 | #68 | Exceptional $42,824 |
| Immigrants | Spain | 99.8 /100 | #69 | Exceptional $42,815 |
| Immigrants | Ethiopia | 99.8 /100 | #70 | Exceptional $42,744 |
| Immigrants | Romania | 99.8 /100 | #71 | Exceptional $42,718 |
| Albanians | 99.8 /100 | #72 | Exceptional $42,584 |
| Mongolians | 99.7 /100 | #73 | Exceptional $42,542 |
| Immigrants | South Africa | 99.7 /100 | #74 | Exceptional $42,508 |