Haitian vs Delaware Householder Income Over 65 years
COMPARE
Haitian
Delaware
Householder Income Over 65 years
Householder Income Over 65 years Comparison
Haitians
Delaware
$51,912
HOUSEHOLDER INCOME OVER 65 YEARS
0.0/ 100
METRIC RATING
318th/ 347
METRIC RANK
$58,214
HOUSEHOLDER INCOME OVER 65 YEARS
5.3/ 100
METRIC RATING
222nd/ 347
METRIC RANK
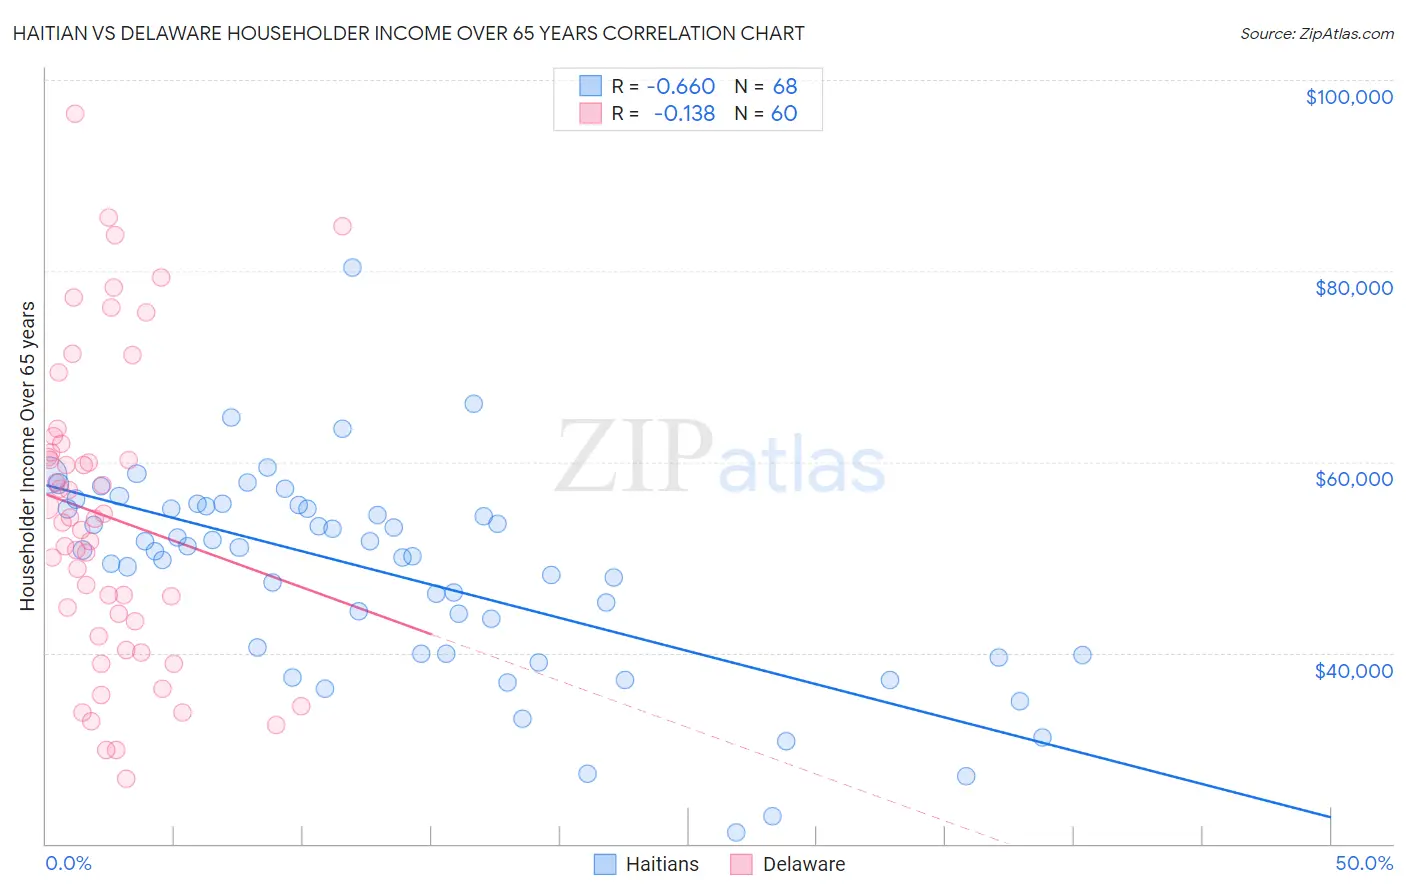
Haitian vs Delaware Householder Income Over 65 years Correlation Chart
The statistical analysis conducted on geographies consisting of 286,836,120 people shows a significant negative correlation between the proportion of Haitians and household income with householder over the age of 65 in the United States with a correlation coefficient (R) of -0.660 and weighted average of $51,912. Similarly, the statistical analysis conducted on geographies consisting of 96,156,233 people shows a poor negative correlation between the proportion of Delaware and household income with householder over the age of 65 in the United States with a correlation coefficient (R) of -0.138 and weighted average of $58,214, a difference of 12.1%.
Householder Income Over 65 years Correlation Summary
| Measurement | Haitian | Delaware |
| Minimum | $21,207 | $26,761 |
| Maximum | $80,361 | $96,428 |
| Range | $59,154 | $69,667 |
| Mean | $48,246 | $54,295 |
| Median | $50,679 | $53,817 |
| Interquartile 25% (IQ1) | $39,901 | $42,460 |
| Interquartile 75% (IQ3) | $55,223 | $61,428 |
| Interquartile Range (IQR) | $15,322 | $18,968 |
| Standard Deviation (Sample) | $10,731 | $15,959 |
| Standard Deviation (Population) | $10,652 | $15,825 |
Similar Demographics by Householder Income Over 65 years
Demographics Similar to Haitians by Householder Income Over 65 years
In terms of householder income over 65 years, the demographic groups most similar to Haitians are Immigrants from St. Vincent and the Grenadines ($51,922, a difference of 0.020%), Immigrants from Honduras ($51,888, a difference of 0.050%), Creek ($51,949, a difference of 0.070%), U.S. Virgin Islander ($52,072, a difference of 0.31%), and Immigrants from Nicaragua ($52,085, a difference of 0.33%).
| Demographics | Rating | Rank | Householder Income Over 65 years |
| Seminole | 0.0 /100 | #311 | Tragic $52,373 |
| Immigrants | Azores | 0.0 /100 | #312 | Tragic $52,121 |
| Immigrants | Nicaragua | 0.0 /100 | #313 | Tragic $52,085 |
| Natives/Alaskans | 0.0 /100 | #314 | Tragic $52,081 |
| U.S. Virgin Islanders | 0.0 /100 | #315 | Tragic $52,072 |
| Creek | 0.0 /100 | #316 | Tragic $51,949 |
| Immigrants | St. Vincent and the Grenadines | 0.0 /100 | #317 | Tragic $51,922 |
| Haitians | 0.0 /100 | #318 | Tragic $51,912 |
| Immigrants | Honduras | 0.0 /100 | #319 | Tragic $51,888 |
| Colville | 0.0 /100 | #320 | Tragic $51,739 |
| Menominee | 0.0 /100 | #321 | Tragic $51,719 |
| British West Indians | 0.0 /100 | #322 | Tragic $51,463 |
| Cajuns | 0.0 /100 | #323 | Tragic $51,397 |
| Immigrants | Congo | 0.0 /100 | #324 | Tragic $51,393 |
| Immigrants | Haiti | 0.0 /100 | #325 | Tragic $51,219 |
Demographics Similar to Delaware by Householder Income Over 65 years
In terms of householder income over 65 years, the demographic groups most similar to Delaware are Immigrants from El Salvador ($58,226, a difference of 0.020%), Tsimshian ($58,202, a difference of 0.020%), Malaysian ($58,244, a difference of 0.050%), Yugoslavian ($58,243, a difference of 0.050%), and Bermudan ($58,171, a difference of 0.080%).
| Demographics | Rating | Rank | Householder Income Over 65 years |
| Immigrants | Ghana | 7.9 /100 | #215 | Tragic $58,624 |
| Immigrants | Middle Africa | 6.2 /100 | #216 | Tragic $58,375 |
| Sudanese | 5.7 /100 | #217 | Tragic $58,281 |
| Panamanians | 5.6 /100 | #218 | Tragic $58,266 |
| Malaysians | 5.5 /100 | #219 | Tragic $58,244 |
| Yugoslavians | 5.5 /100 | #220 | Tragic $58,243 |
| Immigrants | El Salvador | 5.4 /100 | #221 | Tragic $58,226 |
| Delaware | 5.3 /100 | #222 | Tragic $58,214 |
| Tsimshian | 5.2 /100 | #223 | Tragic $58,202 |
| Bermudans | 5.1 /100 | #224 | Tragic $58,171 |
| Venezuelans | 4.4 /100 | #225 | Tragic $58,026 |
| French Canadians | 4.2 /100 | #226 | Tragic $57,975 |
| Japanese | 3.9 /100 | #227 | Tragic $57,919 |
| Immigrants | Albania | 3.6 /100 | #228 | Tragic $57,828 |
| Immigrants | Colombia | 3.0 /100 | #229 | Tragic $57,658 |